Testing Key Resistance, ADBE Stock Gains 0.82% Today
On Juli 20, 2026: price 237.25 USD, trend sideways, RSI 61.1, support 193.41, resistance 237.25. technical analysis of adbe stock. Testing Key Resistance —…

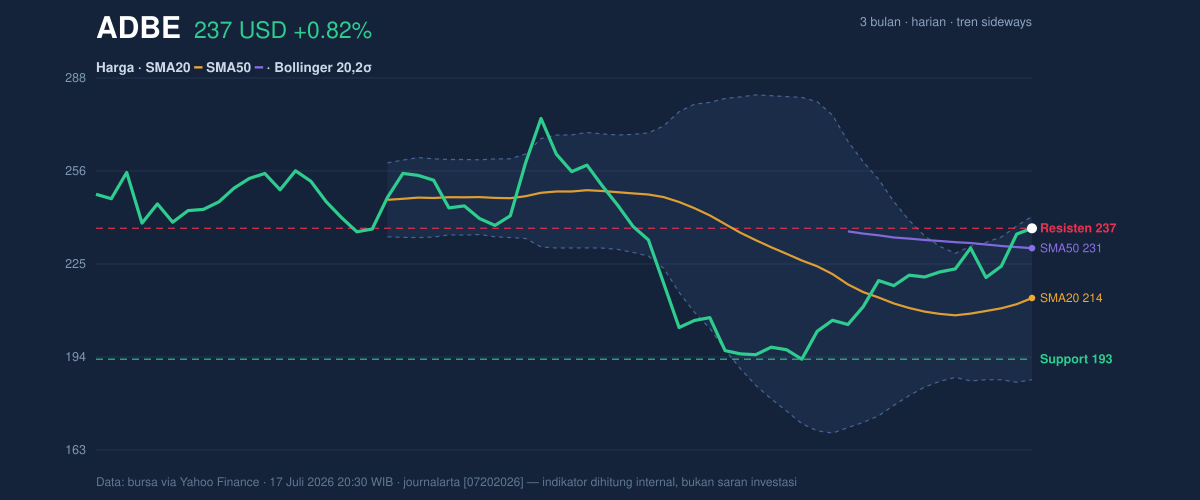
Adobe Inc. shares on the NASDAQ in New York closed at $237.25 on 17 July, up 0.82% on the session and sealing a 20.87% one-month rally that has carried the creative-software maker directly into its 20-day resistance, exchange data via Yahoo Finance show. The move leaves the stock at a genuine technical crossroads: momentum confirms the advance, but the price now sits exactly on a ceiling it has yet to break, with short-term gauges flashing overbought.
Trend & Price Action
The recovery structure is clear. ADBE trades above both its 20-day simple moving average at $213.88 and its 50-day average at $230.57 — the two most-watched trend lines in technical analysis. What has not yet happened is the golden cross: the 20-day line still sits below the 50-day, so the chart has not produced the classic signal that a downtrend has fully reversed. It is converging, though. The 20-day average is sloping upward at 2.78% per five sessions, which means the market is officially labelled "sideways" but is behaving like a market in transition. Price sits at 100% of its 20-day range between support at $193.41 and resistance at $237.25 — in plain terms, it has run out of room at the top of its recent channel. Against the three-month picture, the stock has clawed back more than half of the slide from the $275.44 high to the $190.12 low.
The rebound is real. It is also stretched.
Oscillators & Momentum
Momentum confirms the rally but warns about its age. The RSI at 61.1 — a 0-to-100 speed gauge for price moves — is neutral, leaving headroom before the 70 level that traders read as overbought. The stochastic oscillator tells a different story: %K at 92.5 and %D at 91.1 put it deep in overbought territory above 80, a reading that measures where the close sits within the recent range and typically signals buyers are running short of fresh fuel. The MACD at 1.676 versus a signal line of -2.217 shows a firmly positive crossover, with a histogram of +3.893 confirming momentum is still accelerating rather than fading.
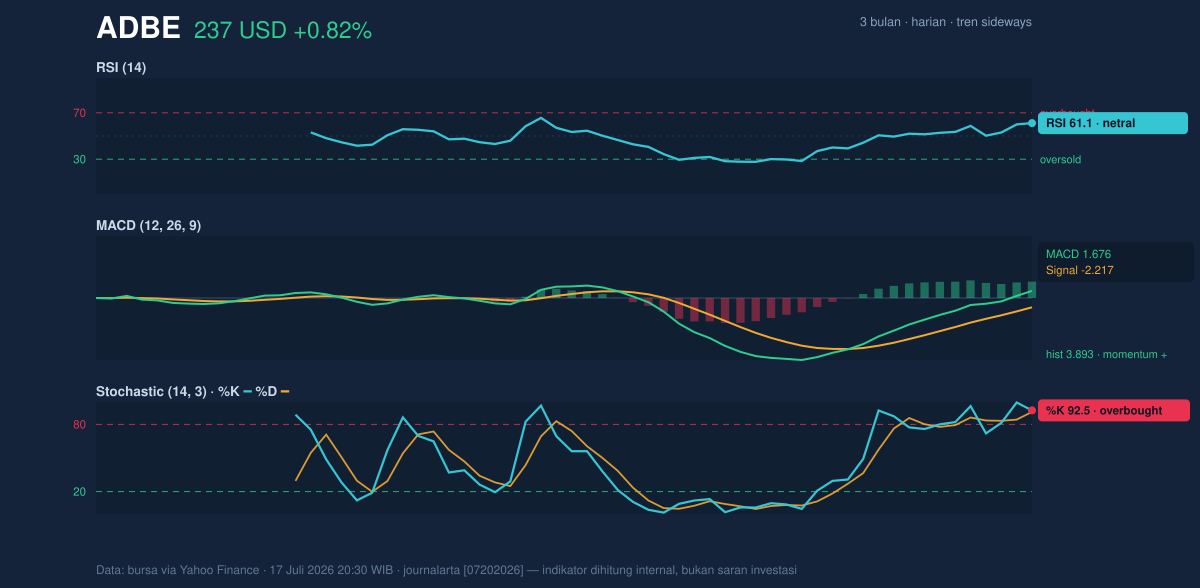
Read together, that mix — neutral RSI, bullish MACD, exhausted stochastic — describes a rally that is intact but mature. Late-stage moves like this tend to resolve either through a pause or a sharp flush, not a straight line upward.
Volatility & Volume
The Bollinger Bands frame the risk. With the price at 93% of the band width (%B), ADBE is hugging the upper rail at $241.26 rather than the mean. Band width has expanded to 25.6%, and the ATR of $8.95 — 3.8% of the share price — means daily swings of roughly nine dollars are now normal. High volatility cuts both ways: it powers breakouts and punishes late entries. On participation, volume of 7.27 million shares is only 1.1× the 20-day average — adequate, not emphatic. The On-Balance Volume line, which accumulates volume on up days versus down days, is rising, so the flow of money supports the move even if the latest session's turnout was unremarkable.
Key Levels & Scenarios
The immediate battleground is $237.25 to $241.26. If buyers push the stock through the upper band and hold it there, the chart opens toward the $275.44 three-month high. If the overbought stochastic wins the argument instead, mean-reversion points first to the 50-day average at $230.57, then the 20-day average at $213.88 — which doubles as the Bollinger midline and the line between a healthy pullback and a failed recovery. Below that, $193.41 and the $190.12 low come back into play.
Technical Verdict: HOLD
The indicators support HOLD (wait & see) rather than action at current levels, for three reasons:
- Trend supports bulls: price above both SMAs, a positive MACD crossover and rising OBV give existing holders no technical reason to exit.
- Timing argues against new entries: an overbought stochastic (92.5/91.1), %B of 93% and price pinned at resistance is a poor risk-reward entry point.
- Volatility raises the cost of chasing: with ATR near $9, buying at resistance risks absorbing a full normal downswing within a single session.
Invalidation: the verdict breaks down if the price falls below $213.88 (SMA20 and Bollinger midline), which would dismantle the rising short-term structure.
- Entry Range: $213.88 – $230.57 (pullback zone between the 20-day and 50-day averages)
- Exit Target: $241.26 first; $275.44 on an extended breakout
- Stop Loss: a close below $213.88
For non-traders: the trend is friendly, but the doorway is crowded — waiting for a dip or a clean breakout beats chasing the stock at its ceiling.
This is a technical reading of market data, not an investment recommendation; the site disclaimer applies. The next scheduled test is the session ahead: whether $237.25 flips from resistance into support, with the $241.26 upper band as the first gate Adobe must clear.
Summary Data ADBE
| Last price | 237.25 USD |
| Change 1 day / 5 days / 1 month | 0.82% / 6.09% / 20.87% |
| Trend / MA-cross | sideways / none |
| SMA20 / SMA50 | 213.88 / 230.57 |
| RSI (14) / Stochastic %K | 61.1 / 92.5 |
| Bollinger %B / ATR | 93% / 8.95 |
| Support / Resistance 20 days | 193.41 / 237.25 |
| Data as of | 17 Juli 2026 20:30 WIB |

