BAC Stock Gains 1.32% Today, Testing Key Resistance
On Juli 22, 2026: price 61.22 USD, trend uptrend, RSI 66.3, support 56.98, resistance 61.59. technical analysis of bac stock. BAC Stock Gains — full details…

Bank of America is pressing against the upper end of its recent trading band, a sign that investors are still willing to pay up for the shares even as short-term momentum starts to look stretched. The stock last changed hands at 61.22 USD, up 1.32% on the day and 6.71% over the past month, according to Yahoo Finance data cited at 21 July 2026 20:30 WIB.
Trend & Price Action
The broader setup remains constructive. BAC is trading above both the SMA20 at 59.34 and the SMA50 at 55.43, which tells readers the shares are still in an established uptrend rather than merely bouncing inside a range. The SMA20 is rising at 1.99% over five days, and that slope matters: it shows the short-term trend is still pointing higher, not flattening out.
What makes this move more interesting is where the price sits inside the band. The stock is at 92% of its 20-day range, with 61.59 marked as near-term resistance and the 56.98 area acting as support. In plain language, BAC is trading close to the ceiling of its recent range, so the market is already pricing in a good part of the recent optimism. That does not signal weakness by itself, but it does mean upside likely needs fresh buying to continue rather than just momentum carryover.
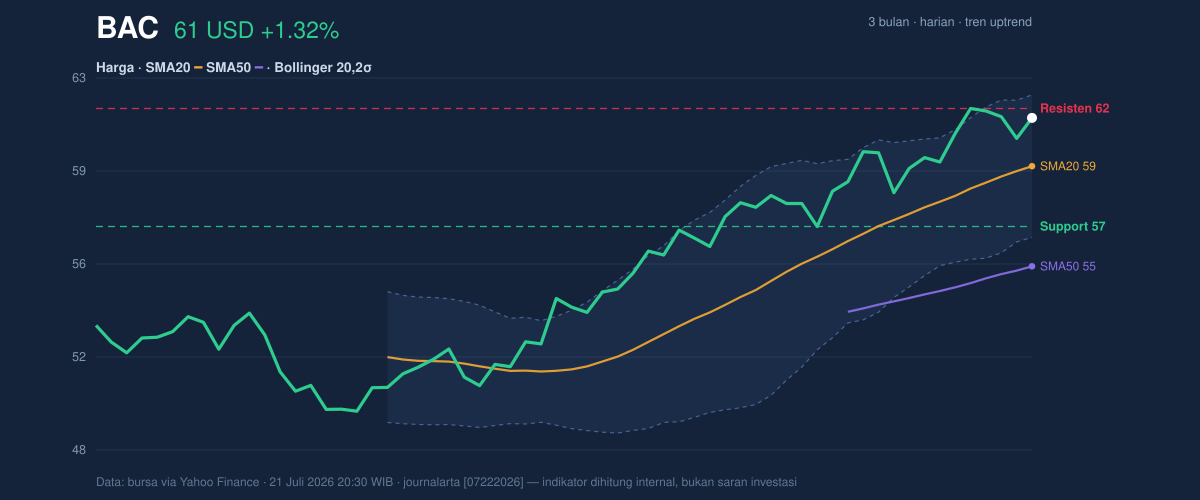
The Bollinger Band structure reinforces that message. With the upper band at 62.12, the middle band at 59.34 and the lower band at 56.56, BAC is now much closer to the top than the middle. The %B reading of 84% says the price is occupying the upper portion of the band, which often reflects strength, but also a market that may be getting ahead of itself in the short run. The band width of 9.4% is described as normal, so this is not yet a volatility breakout regime; it is more a steady climb than a dramatic expansion.
Oscillators & Momentum
The momentum picture is less clean than the trend picture. The RSI at 66.3 is still technically in neutral territory, but it is edging toward the zone where buyers can become exhausted. That is important because RSI does not need to hit an extreme to warn that upside is slowing; it often starts to matter when it approaches the upper band and the trend is already extended.
The stronger warning comes from the stochastics. The Stochastic %K at 82.9 and %D at 78.2 place the stock in overbought territory, which means BAC has been closing near the top of its recent range for several sessions. That is usually a sign of persistent demand, but it also raises the chance of a pause or pullback if buyers stop chasing. As shown in the chart, the oscillator is no longer confirming fresh acceleration so much as showing the move has matured.
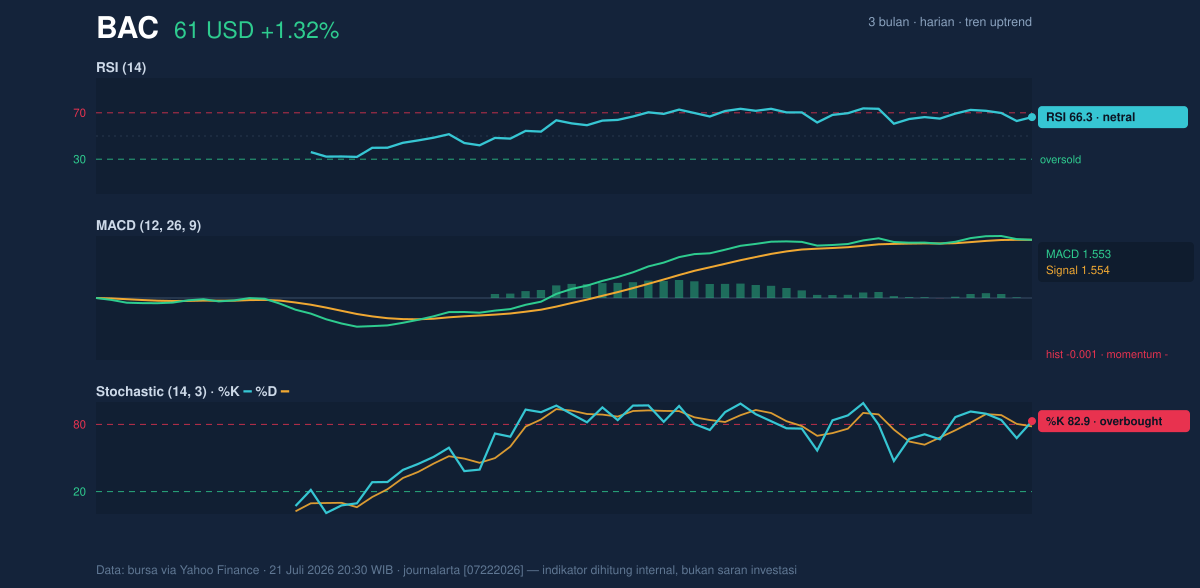
The MACD at 1.553 is nearly identical to the signal line at 1.554, with a histogram of -0.001. That tiny negative reading is subtle but meaningful: it suggests the bullish trend is still intact, yet the pace of upside has stalled. In technical terms, MACD is not flashing a reversal, but it is no longer adding conviction to the advance. When MACD flattens while price remains near resistance, traders often read that as a need for consolidation before the next leg.
Volatility & Volume
Volume also points to a market that is participating, but not with urgency. The latest trading volume was 31,629,100, below the 20-day average of 34,400,590, or about 0.9x normal. That matters because a stock pushing toward resistance on lighter volume can still rise, but the move is less forceful than one backed by a surge in turnover. In other words, the market is leaning bullish, just not aggressively so.
The OBV is rising, which is the more encouraging part of the volume story. OBV, or on-balance volume, tracks whether volume is flowing into the stock on up days. A rising OBV suggests accumulation is still taking place beneath the surface, even if the latest session was not unusually busy. That combination — softer spot volume but improving OBV — often points to steady institutional interest rather than a speculative burst.
Volatility is moderate, not explosive. The ATR at 1.32, equal to 2.2% of price, implies the stock typically moves enough each day to create meaningful but not extreme swings. For readers, that means BAC can still travel quickly if a catalyst appears, but it is not currently behaving like a highly unstable name.
Key Levels & Scenarios
The immediate technical map is fairly clear. The first area to watch is 61.59, the near-term resistance from the 20-hour range. Just above that sits the 62.12 upper Bollinger band, which also matches the 3-month high. That makes the 62 region a natural test of whether BAC can turn a recent advance into a more decisive breakout.
On the downside, 59.34 is the first important reference because it is both the SMA20 and the Bollinger middle band. If BAC loses that level, it would suggest the stock is slipping out of its short-term momentum lane and back toward the center of the range. Below that, 56.98 is the key support area, with 56.56 as the lower Bollinger band. A move through that zone would imply the recent rally has lost traction and the market is rotating back toward the lower half of the range.
The 3-month low at 49.30 remains well below current price, which confirms the larger trend has recovered materially from earlier weakness. But the current question is not whether the long-term base exists; it is whether BAC can digest gains without breaking short-term support.
Technical Verdict: HOLD (wait & see)
HOLD (wait & see)
- RSI at 66.3 and Stochastic %K/%D at 82.9/78.2 show the stock is extended in the short term.
- MACD at 1.553 versus signal 1.554 with a slightly negative histogram suggests momentum is no longer accelerating.
- The broader trend is still positive because price is above the SMA20 at 59.34 and SMA50 at 55.43, while OBV is rising.
- Verdict invalidated if price breaks below 56.98, because that would mean the near-term support and range floor have failed.
- Ideal Entry Range: 59.34 to 56.98
- Exit Target: 61.59 to 62.12
- Stop Loss protection: below 56.56
For non-traders: BAC still looks healthy, but it is close to a level where the rally may need a pause before it can climb further.
The next technical checkpoint is whether the shares can hold above 59.34 while challenging 61.59 and the 62.12 band on the next round of trading.
Summary Data BAC
| Last price | 61.22 USD |
| Change 1 day / 5 days / 1 month | 1.32% / 0.99% / 6.71% |
| Trend / MA-cross | uptrend / none |
| SMA20 / SMA50 | 59.34 / 55.43 |
| RSI (14) / Stochastic %K | 66.3 / 82.9 |
| Bollinger %B / ATR | 84% / 1.32 |
| Support / Resistance 20 days | 56.98 / 61.59 |
| Data as of | 21 Juli 2026 20:30 WIB |

