LLY Momentum Weakens: Stock Gains 2.49% (Juli 22, 2026)
On Juli 22, 2026: price 1,175.41 USD, trend sideways, RSI 53.6, support 1,107.08, resistance 1,235.56. technical analysis of lly stock.

Eli Lilly shares rose 2.49% to $1,175.41 in the latest session, according to Yahoo Finance data on July 21, 2026 at 20:30 WIB, but the move still leaves the stock in a technically awkward middle ground. The price is below the 20-day average of $1,180.69 and well above the 50-day average of $1,116.63, which tells traders the longer-term structure remains intact even as short-term momentum has not fully reclaimed control. In plain terms, Lilly is not in a breakdown, but it is also not yet back in a clean upward push.
Trend & Price Action
The chart shows a stock that is moving sideways rather than trending decisively, with the SMA20 slope at 1.13% over five days. That slight upward tilt matters because it suggests the recent pullback has not turned into a deeper trend reversal. At the same time, the fact that the price sits just below the SMA20 means buyers have not yet forced a full short-term recovery above the recent average cost base.
The broader structure is still supported by the SMA50 at $1,116.63, which acts as a lower reference point for the market’s confidence. Lilly is also trading around the middle of its recent band, with price at 53% of the 20-day range, so this is neither an overheated breakout nor a distressed selloff. That positioning is important: it usually signals a market waiting for a catalyst rather than one already committed to a direction.
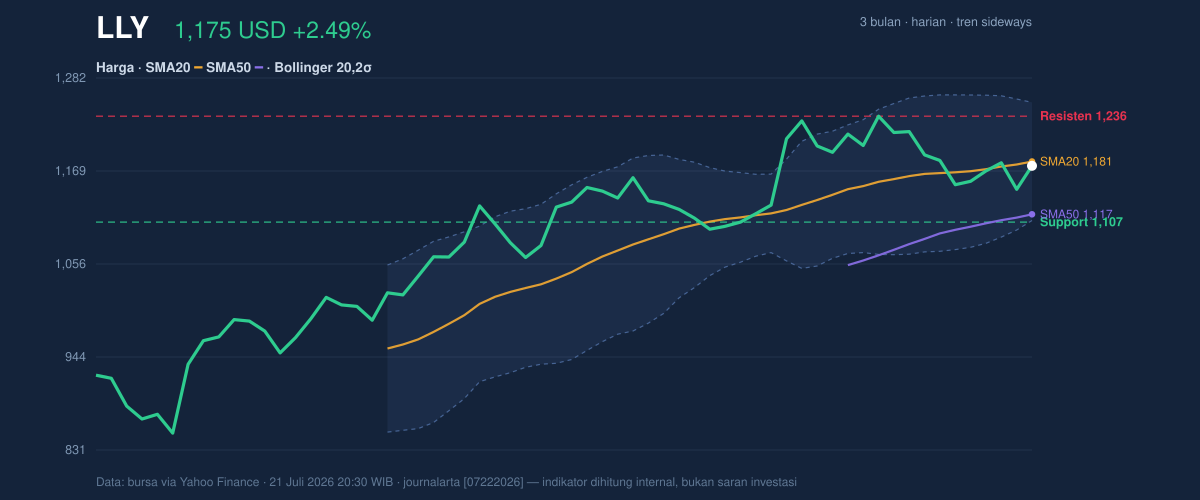
The Bollinger Bands reinforce that reading. Price is near the middle band at $1,180.69, with the upper band at $1,252.35 and the lower band at $1,109.02. A normal 12.1% band width suggests volatility is not compressed into an imminent squeeze, but it is also not stretched enough to imply panic. In practical terms, the stock has room to move, yet the chart is not flashing a strong breakout signature.
Oscillators & Momentum
The momentum picture is more cautious than the price action alone might suggest. RSI at 53.6 is neutral, which means the stock is not overbought and not oversold; it is simply balanced. That matters because neutral RSI often reflects indecision rather than conviction, especially when the price is sitting near a moving average.
Stochastic readings add a similar message. %K at 35.6 and %D at 28.5 are also neutral, but they sit in a lower zone than RSI, hinting that recent upside has not yet translated into strong follow-through. This is the kind of setup that can precede either a recovery or another pause, depending on whether buyers can keep lifting the stock above nearby resistance.
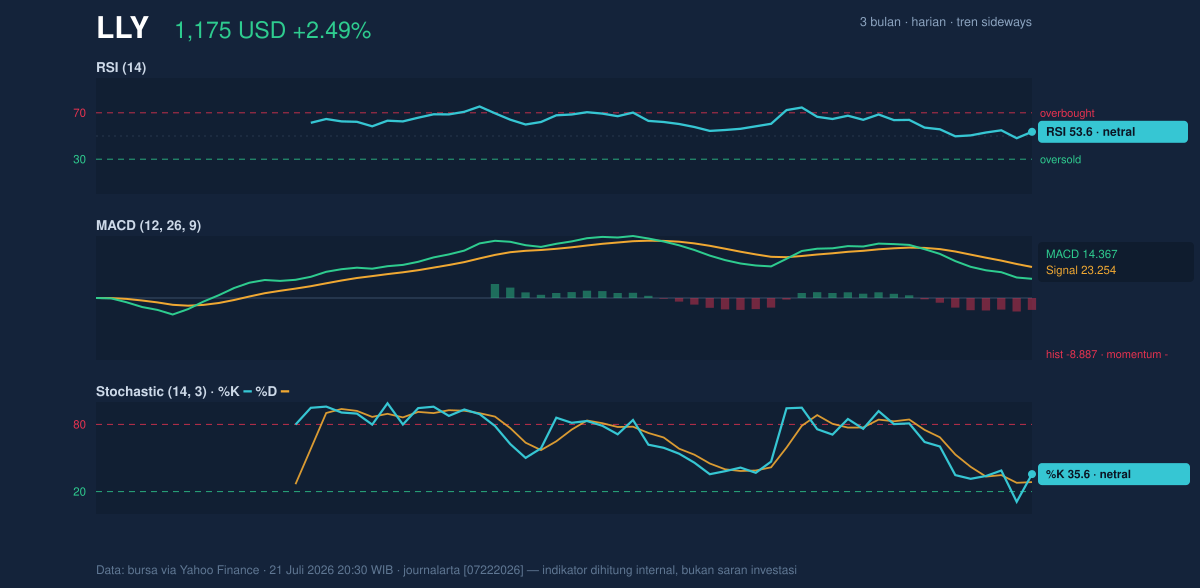
The clearest warning sign comes from MACD. MACD at 14.367 is below the signal line at 23.254, and the histogram at -8.887 shows negative momentum. For readers unfamiliar with the term, MACD compares shorter- and longer-term trend speed; when it sits below the signal line, it usually means the recent push is losing force. That does not automatically mean a larger decline is coming, but it does mean the current rebound lacks strong confirmation.
Volatility & Volume
Volatility is moderate, not extreme. ATR at 38.94, equal to 3.3% of price, suggests the stock can still swing meaningfully in a session, but not in a disorderly way. That makes nearby technical levels more relevant, because a move of roughly this size can test support or resistance without needing a major news shock.
Volume, however, is softer than ideal for a decisive move. The latest session saw 2,090,700 shares change hands versus a 20-day average of 2,983,655, or just 0.7× normal. Lower volume on a positive day often means the advance has not yet attracted broad participation. That is especially relevant here because the OBV is rising, which indicates cumulative buying pressure is improving even though the day-to-day trading crowd was lighter. In short, the accumulation signal is constructive, but it has not yet been matched by strong turnover.
Key Levels & Scenarios
The nearest chart markers matter because Lilly is sitting between them. Support at $1,107.08 lines up closely with the Bollinger lower band at $1,109.02 and near the 50-day average of $1,116.63, making this zone the first real test of whether the stock can hold its medium-term base. On the upside, resistance at $1,235.56 sits below the Bollinger upper band at $1,252.35 and near the 3-month high of $1,249.45, which means the chart has a clearly defined ceiling overhead.
If price holds above the support band and regains the SMA20 at $1,180.69, the setup improves because the market would be reclaiming its short-term average. If it fails to hold $1,107.08, the technical tone weakens quickly because that would place the stock below the nearest support cluster and nearer the lower boundary of the recent range. The fact that the stock is still far above the 3-month low of $850.51 shows the longer trend has not been damaged, but the current pattern needs confirmation.
Technical Verdict: HOLD (wait & see)
HOLD (wait & see)
- MACD is negative, which means the rebound lacks strong momentum confirmation.
- Price is below the SMA20, so the short-term trend has not fully turned back in favor of buyers.
- OBV is rising and the SMA50 remains supportive, which keeps the larger structure constructive.
Verdict invalidated if price falls below $1,107.08.
- Ideal entry range: $1,109.02 to $1,180.69
- Exit target: $1,235.56 to $1,252.35
- Stop loss protection: below $1,107.08
For non-traders, this means Lilly’s chart is holding up, but it has not yet shown enough strength to prove the latest bounce is the start of a cleaner move. “We’re not out of the woods, but the floor is still there,” one market technician might say.
Summary Data LLY
| Last price | 1,175.41 USD |
| Change 1 day / 5 days / 1 month | 2.49% / 1.98% / 6.65% |
| Trend / MA-cross | sideways / none |
| SMA20 / SMA50 | 1,180.69 / 1,116.63 |
| RSI (14) / Stochastic %K | 53.6 / 35.6 |
| Bollinger %B / ATR | 46% / 38.94 |
| Support / Resistance 20 days | 1,107.08 / 1,235.56 |
| Data as of | 21 Juli 2026 20:30 WIB |


