MRK Stock Technicals Today: Gains 1.50%, Momentum Weakens
On Juli 22, 2026: price 126.26 USD, trend uptrend, RSI 55.0, support 119.60, resistance 129.56. technical analysis of mrk stock. MRK Stock Technicals — full…

Merck is holding a firmer tone on the NYSE, with the shares closing at 126.26 USD, up 1.50% on the day and 9.33% over the past month. For international readers, the key point is not just that the stock is rising, but that it is doing so while still sitting below a nearby resistance band, which means the market is testing whether this rebound has enough force to extend.
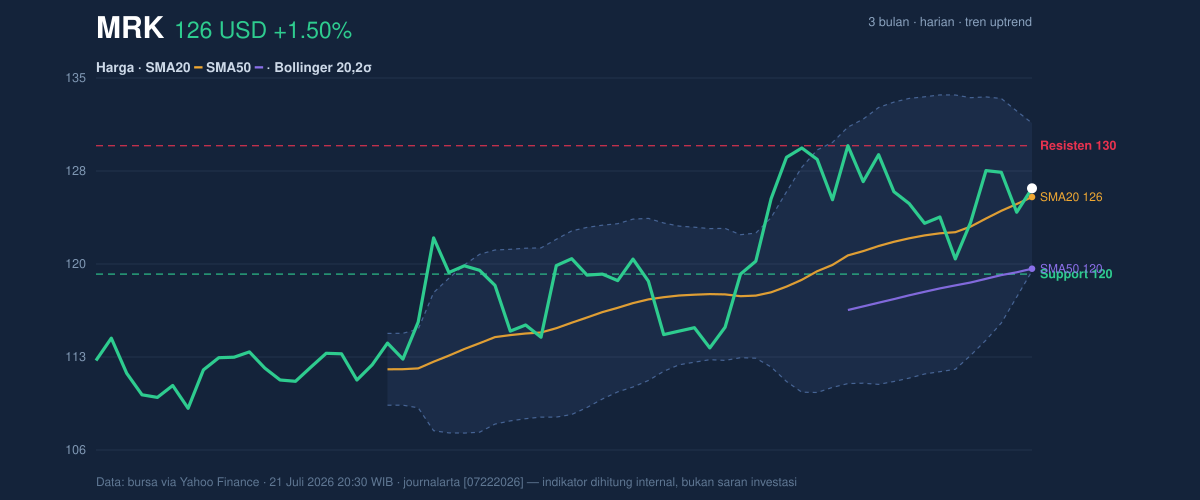
Merck’s latest move fits a broader recovery structure rather than a sharp breakout. The stock is trading above its SMA20 at 125.58 and comfortably above its SMA50 at 120.02, which usually signals that short-term price action is aligned with the medium-term trend. The uptrend is also supported by the SMA20 slope of 2.22% over 5 days, a sign that the average itself is still rising, not flattening out. That matters because a rising moving average often acts like a moving floor for prices, helping explain why dips have been finding buyers.
Still, the chart shows a market that is advancing without full conviction. The shares are positioned at about 67% of the 20-hour range, which leaves room to test the upper boundary, but they have not yet pushed through it. The nearest resistance is 129.56, while support sits at 119.60. In plain language, Merck is trading in the upper half of its recent band, but not yet in clear open air.
Trend & Price Action
The broader structure remains constructive because price is above both key moving averages and the stock is trading closer to the top of its recent range than the bottom. The 3-month high of 131.74 is now the obvious reference point, and the distance between that level and the current price is not large enough to dismiss a breakout attempt, but it is also not close enough to call one confirmed. The 3-month low of 107.90 remains far below, showing that the recent rebound has already recovered a meaningful amount of lost ground.
What this means for readers is simple: the trend is still pointing upward, but the market has not yet proved it can clear the next ceiling. A stock can be in an uptrend and still pause at resistance.
Oscillators & Momentum
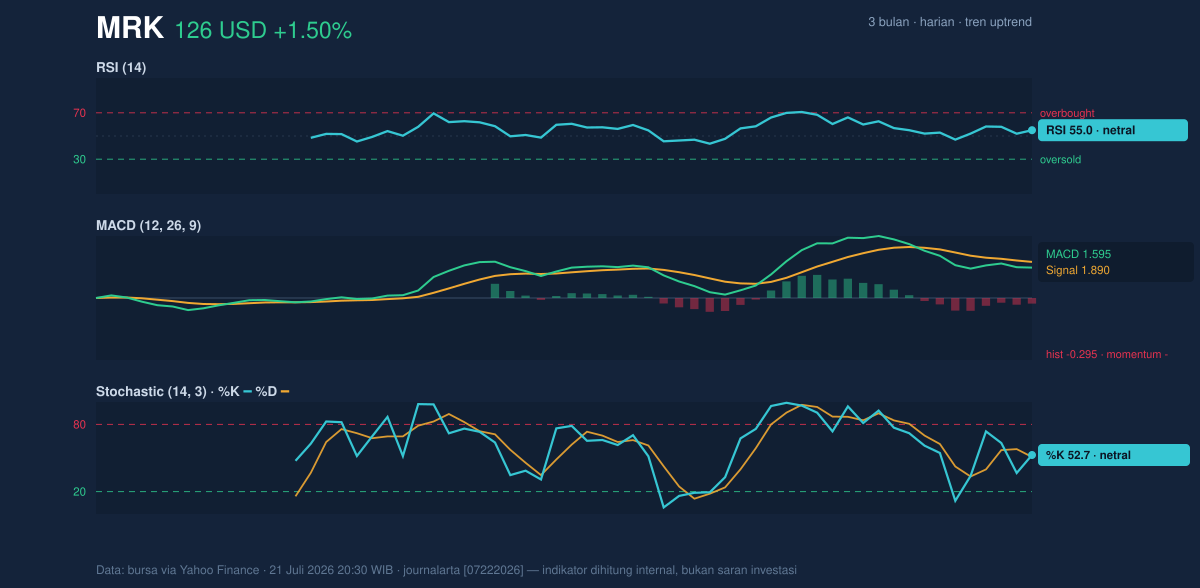
Momentum indicators are telling a more cautious story than the price trend. The RSI at 55.0 is neutral, which means the stock is neither overbought nor oversold. That is usually a healthy reading for a trend, because it suggests there is still room for further gains without immediate exhaustion. The Stochastic %K at 52.7 and %D at 50.9 are also neutral, reinforcing the idea that the move is not stretched.
The more important warning comes from the MACD at 1.595 versus its signal line at 1.890, with a histogram of -0.295. In practical terms, MACD is a trend-following momentum gauge: when the MACD line sits below the signal line, upside momentum is losing some speed even if the price is still rising. That divergence matters because it suggests the rally is currently being carried more by price structure than by accelerating momentum.
So the trend is positive, but momentum is not yet fully confirming it.
Volatility & Volume
The Bollinger Band setup adds another layer of context. With the middle band at 125.58, the stock is essentially hovering near its short-term mean, while the upper band at 131.32 and lower band at 119.84 frame the likely near-term trading envelope. The %B reading of 56% indicates price is just above the midpoint of the band, not pressing hard against the top. The band width of 9.1% is normal, which suggests volatility is neither unusually compressed nor expanded. In other words, the chart does not yet show the kind of squeeze that often precedes a sharp breakout.
ATR confirms that message. The ATR(14) of 3.72, equal to 2.9% of price, points to moderate daily movement. That is enough to allow a meaningful push toward resistance, but also enough to punish weak entries if the move fades.
Volume is the part of the picture that tempers enthusiasm most clearly. Last volume was 7,343,100, below the 20-day average of 10,132,100, or about 0.7x normal. On top of that, OBV is falling, which indicates that cumulative volume flow is not yet backing the recent price rise. This is often a sign that the move is happening on lighter participation, and lighter participation can make rallies easier to stall at resistance.
Key Levels & Scenarios
The immediate map is straightforward. A sustained move above 129.56 resistance would improve the case that Merck is attempting a retest of the 131.32 Bollinger upper band and then the 131.74 three-month high. If the stock fails there, the first area to watch is the 125.58 SMA20, which is both a trend marker and the Bollinger middle band. A deeper slip toward 119.84 would bring the lower band and the 119.60 support zone into focus.
The signal here is not collapse, but compression around a decision point.
Technical Verdict: HOLD (wait & see)
HOLD (wait & see)
- Reason 1: Price is above the SMA20 at 125.58 and SMA50 at 120.02, so the trend remains constructive.
- Reason 2: RSI 55.0 and Stochastic %K 52.7 / %D 50.9 are neutral, which supports continuation but does not confirm acceleration.
- Reason 3: MACD 1.595 below signal 1.890 and OBV down warn that participation and momentum are not fully confirming the price rise.
- Verdict invalidated if price breaks above 129.56 resistance with stronger volume, or if it falls below 119.60 support and loses the short-term trend floor.
- Ideal Entry Range: 125.58 to 119.84
- Exit Target: 129.56 to 131.32
- Stop Loss protection: Below 119.60
For non-traders, this means Merck looks healthy, but the market is still waiting for proof that the recent climb has enough strength to keep going.
Summary Data MRK
| Last price | 126.26 USD |
| Change 1 day / 5 days / 1 month | 1.50% / 4.54% / 9.33% |
| Trend / MA-cross | uptrend / none |
| SMA20 / SMA50 | 125.58 / 120.02 |
| RSI (14) / Stochastic %K | 55.0 / 52.7 |
| Bollinger %B / ATR | 56% / 3.72 |
| Support / Resistance 20 days | 119.60 / 129.56 |
| Data as of | 21 Juli 2026 20:30 WIB |


