AVGO Stock Gains 2.67% Today, Testing Key Resistance
On Juli 23, 2026: price 396.81 USD, trend sideways, RSI 53.3, support 360.45, resistance 401.11. technical analysis of avgo stock. AVGO Stock Gains — full…

For global investors, Broadcom’s chart is still holding above a key short-term average, but it is now pressing into a zone where momentum needs to prove itself.
Broadcom Inc. (NASDAQ: AVGO) finished at 396.81 dollars, up from 386.50 dollars in the previous session, a gain of 2.67% on the day. The move leaves the stock near the upper end of its recent trading range, with the price sitting at 89% of the 20-hour range between 360.45 dollars and 401.11 dollars, as shown in the chart. That positioning matters because shares near the top of a range often signal either sustained demand or an exhaustion point; the next move tends to reveal which one is in control.
Trend & Price Action
The broader setup is still more sideways than directional. The stock’s trend is described as sideways, and the SMA20 at 380.73 dollars is still sloping down at -0.61% over five days, which suggests the short-term average has not yet turned decisively higher. Even so, the share price is above the SMA20, which is an important sign that buyers have recently been willing to pay up after a period of softer trading. The more consequential reference point is the SMA50 at 400.81 dollars. Price is just below that line, so Broadcom is close to a level that often acts as a gatekeeper between a neutral consolidation and a firmer recovery.
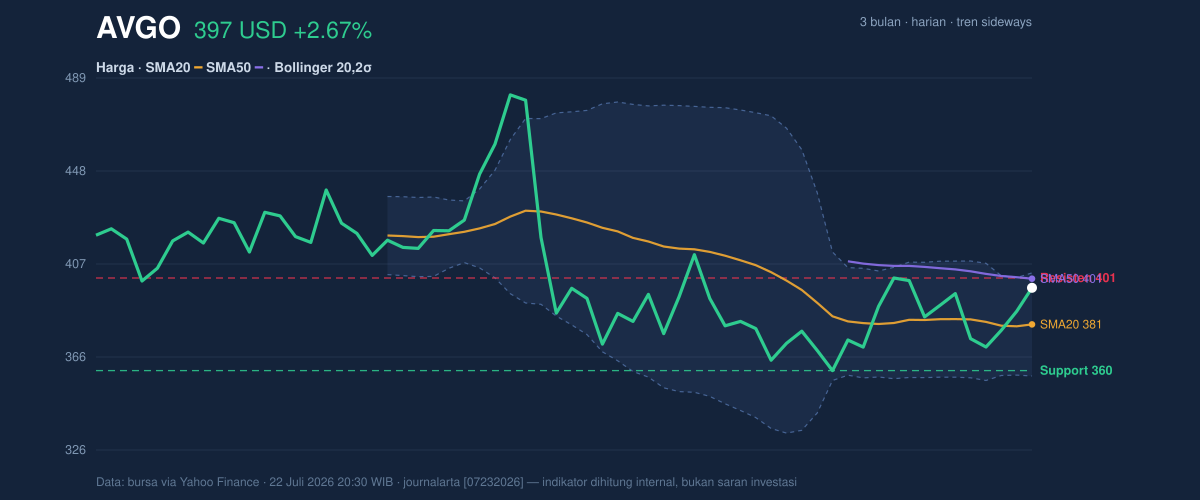
The lack of a new MA-cross — meaning no fresh moving-average crossover signal — tells us the chart has not yet produced a clean trend change. In plain language, the stock has improved, but it has not fully escaped the range that has defined it. The broader three-month band reinforces that point: Broadcom is trading well below the 3-month high of 495.00 dollars, but still above the 3-month low of 356.43 dollars. That is a middle-ground posture, not a breakout.
Oscillators & Momentum
Momentum is constructive, but not emphatic. The RSI at 53.3 is neutral, which means the stock is neither overbought nor oversold. That is usually a sign of balance rather than conviction. The Stochastic %K at 79.0 and %D at 60.1 are also labeled neutral, though the %K line sitting higher than %D suggests near-term momentum has improved faster than the slower signal line. That can support further upside, but it can also fade quickly if price stalls near resistance.
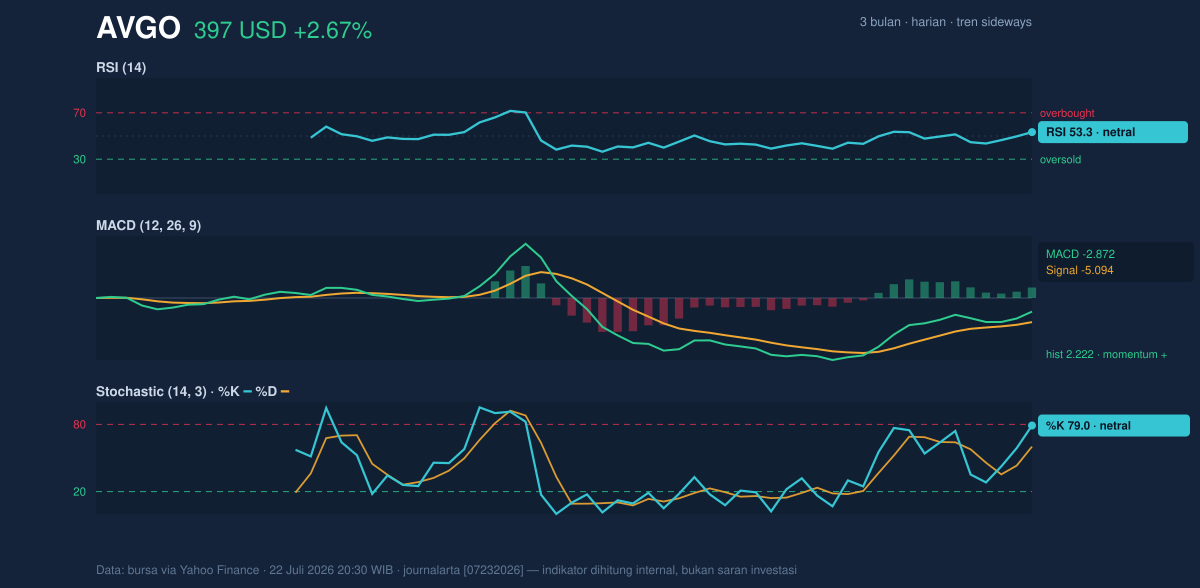
The cleaner message comes from MACD. Broadcom’s MACD at -2.872 is still below zero, but the signal line at -5.094 is lower still, leaving a positive histogram of 2.222. That combination usually means downside momentum has eased and the shorter-term trend is improving relative to the longer one. In practical terms, it is a recovery signal, not a full trend reversal signal. The chart is showing improvement before confirmation.
Volatility & Volume
Volatility is elevated. The ATR at 16.47 dollars, or 4.2% of the share price, indicates Broadcom can still move sharply in either direction over a short period. That matters because a stock sitting near resistance with high ATR can break out, but it can also reverse quickly if buyers lose momentum. The Bollinger Bands help frame that tension. Price is trading with %B at 85%, which means it is near the upper band at 403.38 dollars, while the lower band sits at 358.08 dollars and the midline at 380.73 dollars. The band width of 11.9% is normal, so this is not a squeeze setup waiting for a violent release; instead, it is a standard volatility regime with price leaning toward the top of the envelope.
Volume does not fully confirm the latest move. Last session volume was 16,910,400, below the 20-hour average of 23,369,490, or about 0.7x normal. That means the advance happened without unusually heavy participation. Still, OBV is rising, which is important because on-balance volume tracks whether money is accumulating over time. When OBV rises even as volume is lighter on a given day, it suggests the broader flow has not turned negative. In other words, the recent lift has some underlying support, but not the kind of broad conviction that usually accompanies a decisive breakout.
Key Levels & Scenarios
The first level to watch is 401.11 dollars, the 20-hour resistance, with the Bollinger upper band at 403.38 dollars just above it. A move through that area would show the stock is not only testing resistance but also pushing against the upper edge of its recent volatility envelope. If that fails, the next important cushion is the SMA20 at 380.73 dollars, which also matches the Bollinger middle band. Below that, the chart opens toward 360.45 dollars, the 20-hour support, and then the 358.08-dollar lower band.
The signal is straightforward: Broadcom is improving, but it is still working inside a range rather than clearing it. That makes the current setup more about confirmation than celebration, especially with price near resistance and volume below average.
Technical Verdict: HOLD (wait & see)
HOLD (wait & see)
- MACD histogram is positive, showing momentum has improved, but the MACD line is still below zero, so the recovery is not fully confirmed.
- Price is above the SMA20 and near the upper Bollinger area, which supports the short-term tone, but price remains below the SMA50 at 400.81.
- Volume is only 0.7x normal, so the latest rise does not yet have strong participation behind it.
- Verdict invalidated if price breaks below 360.45, because that would place the stock under the nearest support and back toward the lower band area.
- Ideal Entry Range: 380.73 to 396.81
- Exit Target: 400.81 to 403.38
- Stop Loss protection: below 360.45
In plain English, Broadcom is improving, but the chart still needs a stronger push before the move looks settled.
Summary Data AVGO
| Last price | 396.81 USD |
| Change 1 day / 5 days / 1 month | 2.67% / 0.64% / 4.38% |
| Trend / MA-cross | sideways / none |
| SMA20 / SMA50 | 380.73 / 400.81 |
| RSI (14) / Stochastic %K | 53.3 / 79.0 |
| Bollinger %B / ATR | 85% / 16.47 |
| Support / Resistance 20 days | 360.45 / 401.11 |
| Data as of | 22 Juli 2026 20:30 WIB |


