CVX Stock Gains 1.00% Today, Testing Key Resistance
On Juli 23, 2026: price 192.98 USD, trend sideways, RSI 69.7, support 165.69, resistance 192.98. technical analysis of cvx stock. CVX Stock Gains — full…

Chevron finished at 192.98 on the NYSE, up 1.00% on the day and 9.66% over the past month, with the stock now pressing right up against its recent ceiling, according to market data cited through Yahoo Finance. The move matters because it is not just a one-day bounce: Chevron is trading above both its SMA20 at 177.15 and SMA50 at 182.35, which tells traders the shares have recovered enough to sit above their short- and medium-term averages. But the chart also shows the rally has reached a point where strength can start to look stretched rather than simply strong.
Trend & Price Action
The broader pattern is still described as sideways, even though the short-term slope is rising, with the SMA20 up 1.80% over 5 days. That combination usually means the stock is not in a clean breakout trend yet; instead, it is moving within a range but leaning upward inside that range. With price above both moving averages and no fresh MA-cross, the chart is showing confirmation of recovery rather than a new trend regime. In plain language, Chevron has improved, but the market has not yet delivered the kind of moving-average crossover that often marks a stronger, more durable shift.
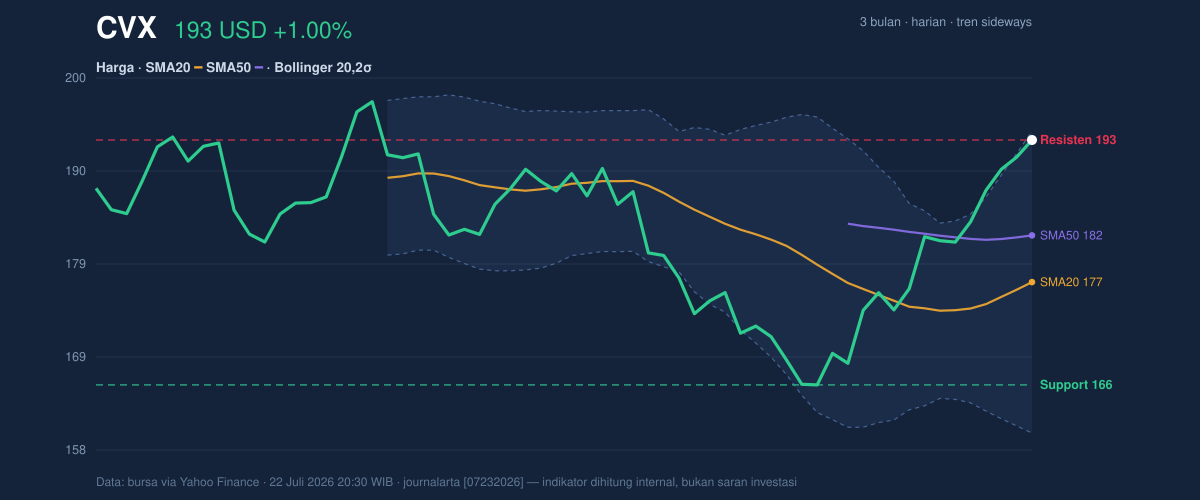
The price is also sitting at 100% of its 20-day range, which is a useful signal: buyers have pushed the stock to the top of the recent band, but that also leaves less room for immediate follow-through unless new demand appears. The 3-month high at 198.87 is close enough to matter, and the 3-month low at 164.78 shows how much ground has already been recovered. The message from the chart is simple.
Chevron is near the top of the recent box.
Oscillators & Momentum
Momentum is where the picture becomes more nuanced. The RSI at 69.7 is labeled neutral in the data, but it is very near the classic overbought threshold, so it should be read as “strong, but extended.” RSI measures the speed of recent gains; when it approaches 70, it often means enthusiasm is high and the market may need either a pause or fresh catalysts to keep advancing. By contrast, the Stochastic %K at 97.3 and %D at 98.0 are clearly overbought, which signals the close is consistently landing near the top of the recent range. That is not a reversal signal by itself, but it does warn that momentum is very crowded on the upside.
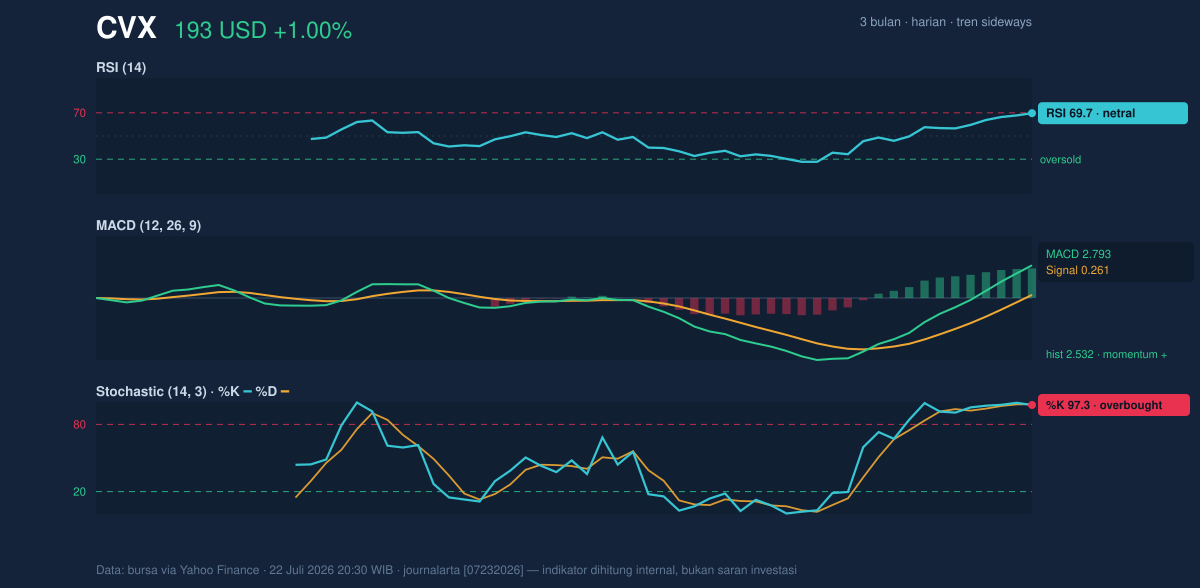
The MACD at 2.793, above its signal line at 0.261 with a 2.532 histogram, is the strongest evidence that upward momentum is still intact. MACD tracks whether shorter-term price movement is outrunning longer-term movement; here, the positive spread says the recent advance is still winning. So the oscillators are not all pointing the same way: MACD supports the trend, while Stochastic says the move is stretched. That mix often appears when a stock is strong but vulnerable to a pause.
Volatility & Volume
Volatility is moderate rather than explosive, with ATR(14) at 3.65, or 1.9% of price. ATR is a measure of typical daily movement, so this reading suggests Chevron can still move meaningfully, but not in a panic-like way. Bollinger Bands add another layer: price is hovering just under the upper band at 193.97, with the %B at 97% and a normal 19.0% band width. That combination means the stock is trading very near the top of its volatility envelope, but without the kind of band squeeze that often precedes a sharp expansion. In other words, the market is already pricing in a lot of near-term strength, and the current setup looks more like pressure against resistance than a quiet base waiting to explode.
Volume, however, is not confirming the move aggressively. The latest 6,131,900 shares traded are only 0.7× the 20-day average of 8,808,805, which suggests the advance has not yet been backed by heavy participation. That matters because rallies that push into resistance on lighter volume can stall if fresh buyers do not arrive. Still, OBV is rising, and that indicates the broader accumulation trend has not broken. So the market is seeing some underlying support, but not a decisive surge in conviction.
Key Levels & Scenarios
The immediate reference point is clear: 192.98 is both the latest close and the 20-day resistance level in the data. Above that, the next obvious test is the 3-month high at 198.87. On the downside, the first technical cushion sits around the SMA20 at 177.15, which also matches the Bollinger middle band, while deeper support is marked at the 20-day support at 165.69 and the 3-month low at 164.78. If Chevron can hold above the short-term averages, the chart remains constructive; if it slips back below the middle band, the recent momentum would start to look more like a failed push than a sustained advance.
Technical Verdict: HOLD (wait & see)
HOLD (wait & see) — the chart is constructive, but it is also stretched at resistance.
- MACD remains positive, showing the trend still has upward momentum.
- Price is above SMA20 and SMA50, which keeps the structure supportive.
- Stochastic is overbought and %B is 97%, so the stock is pressing the upper edge of its recent range rather than building room below it.
- Verdict invalidated if price falls below 177.15, because that would mean Chevron has lost the SMA20 and the Bollinger midline.
- Ideal Entry Range: 177.15 to 182.35
- Exit Target: 193.97 to 198.87
- Stop Loss protection: 165.69
In plain English, Chevron is still technically healthy, but it is already close to the top of its recent range, so the chart favors patience until the next move proves itself.
Summary Data CVX
| Last price | 192.98 USD |
| Change 1 day / 5 days / 1 month | 1.00% / 6.27% / 9.66% |
| Trend / MA-cross | sideways / none |
| SMA20 / SMA50 | 177.15 / 182.35 |
| RSI (14) / Stochastic %K | 69.7 / 97.3 |
| Bollinger %B / ATR | 97% / 3.65 |
| Support / Resistance 20 days | 165.69 / 192.98 |
| Data as of | 22 Juli 2026 20:30 WIB |

