MRK Stock Gains 0.96% Today, Momentum Weakens
On Juli 23, 2026: price 127.47 USD, trend uptrend, RSI 56.8, support 120.60, resistance 129.56. technical analysis of mrk stock. MRK Stock Gains — full details…

Merck is trading with a constructive short-term bias, but the tape still shows one important warning: price has climbed above near-term averages while momentum has not fully confirmed the move.
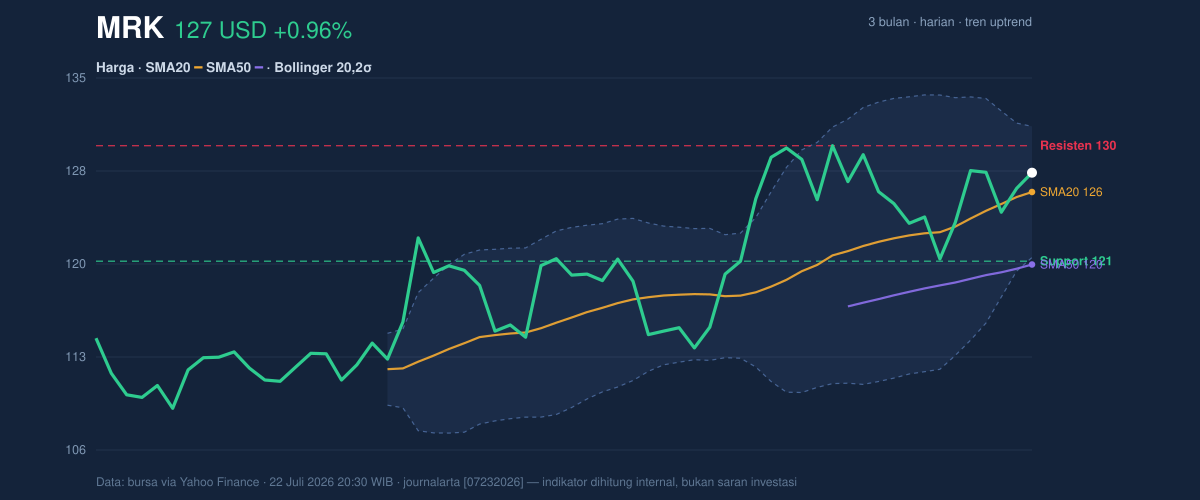
Merck & Co. shares on the NYSE last changed hands at 127.47 USD, up 0.96% on the day, extending gains of 3.12% over 5 days and 6.58% over 1 month, according to market data from Yahoo Finance. For international readers, that means the stock is acting better than it did a few weeks ago, but the advance is not yet the kind of broad, forceful breakout that usually signals a fresh trend leg. Price is now above both the SMA20 at 125.97 and the SMA50 at 120.34, which keeps the broader chart in uptrend territory. Yet the absence of a new moving-average cross means the rally is being driven more by price recovery than by a fresh structural shift.
The chart also shows Merck sitting well above its short-term trend line, but not at an extreme.
That matters.
Trend & Price Action
As shown in the chart, Merck’s position above the SMA20 and SMA50 tells traders that buyers are still in control of the medium-term structure. The SMA20 slope of 2.18% over 5 days is another sign that the recent move has been rising at a steady pace rather than stalling. In plain language, a rising moving average means the average price itself is climbing, which usually reflects persistent demand.
The stock is also trading at 77% of its 20-hour range, with support at 120.60 and resistance at 129.56. That location is important: Merck is closer to the upper end of the recent range, but still below resistance, so the market is pricing in strength without yet proving a breakout. The 3-month high of 131.74 sits just above the current ceiling, which means the stock is approaching an area where previous rallies have previously run out of steam.
A move through resistance would be a sign that recent buyers are still willing to pay up.
Failure there would say the market is less convinced.
Oscillators & Momentum
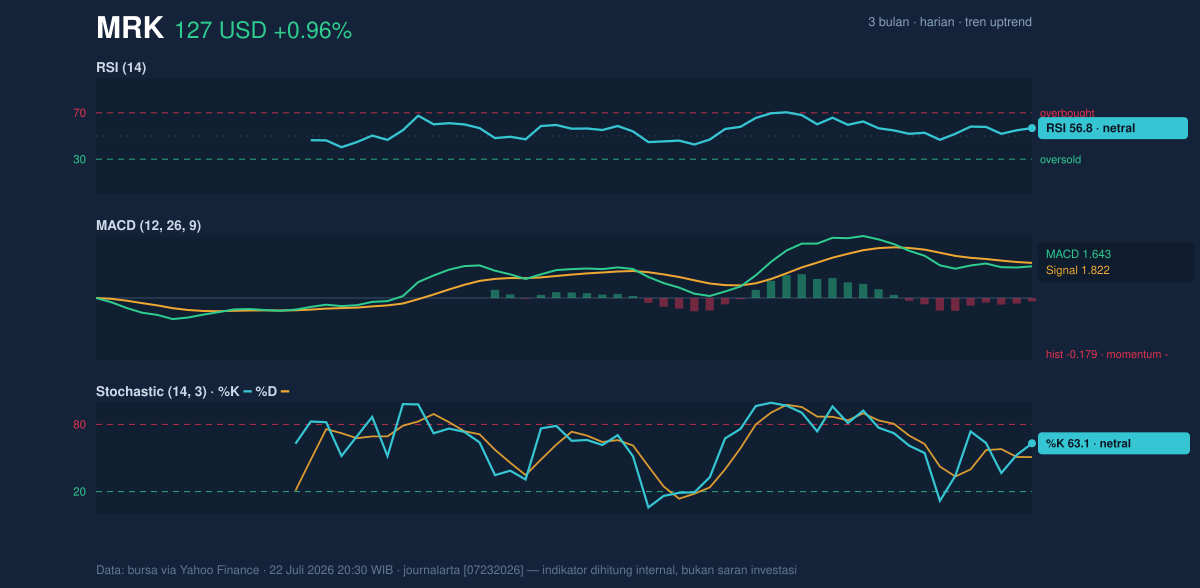
The momentum picture is more mixed than the price chart. The RSI at 56.8 is neutral, which suggests the stock is neither overbought nor oversold. That’s often what a healthy trend looks like mid-course: enough strength to stay elevated, but not so stretched that it is immediately vulnerable to profit-taking. The Stochastic %K at 63.1 and %D at 50.8 also sit in neutral territory, pointing to improving momentum but not an overheated condition.
The caution flag comes from MACD. Merck’s MACD at 1.643 is below its signal line at 1.822, leaving a negative histogram of -0.179. For general readers, MACD is a trend-following momentum gauge: when it sits below the signal line, it usually means the latest push is losing some force, even if the price itself is still rising. That is the key tension in Merck right now — the chart is trending up, but the momentum engine has not fully re-accelerated.
That mismatch does not break the trend.
It does, however, make the next move more important.
Volatility & Volume
Volatility is contained rather than explosive. Merck’s Bollinger Bands show an upper band at 131.06, a middle band at 125.97, and a lower band at 120.88, with %B at 65% and band width at 8.1%, described as normal. %B at 65% means the price is above the middle of the band range but not pressing against the top, which fits a stock that is firm but not stretched. Normal band width also suggests there is no squeeze building for an imminent volatility burst, so the market is not yet signaling a dramatic expansion in either direction.
Volume, however, is softer than ideal. Last volume was 7,790,200 versus a 20-day average of 9,998,230, or 0.8x normal. That means the latest advance happened with less participation than usual. When price rises on lighter volume, it can still be valid, but it often lacks the conviction seen in stronger breakouts. The OBV is down, which reinforces that concern: on-balance volume measures whether money is flowing into or out of a stock, and a falling OBV while price rises can hint that the rally is not fully supported by accumulation.
In short, the price is improving faster than the crowd is joining in.
That is a real signal.
Key Levels & Scenarios
The near-term map is fairly clear. Support at 120.60 is the first line the market would need to defend if sellers reappear. That level sits close to the Bollinger lower band at 120.88 and above the SMA50 at 120.34, so it is a confluence zone where trend followers may watch for a bounce. On the upside, resistance at 129.56 comes before the 3-month high at 131.74, making the area between those two levels the key test for continuation.
If Merck clears 129.56 and holds above it, the chart would start to look like a genuine breakout attempt toward the upper band at 131.06 and the 3-month high at 131.74. If it fails there, the stock may revert toward the middle band at 125.97, where the market has already shown it is comfortable trading.
The latest reading says the stock is elevated, but not yet fully proven.
That is the whole story.
Technical Verdict: HOLD (wait & see)
HOLD (wait & see)
- Price is above SMA20 and SMA50, keeping the broader structure constructive.
- MACD is negative versus its signal line, showing momentum is not fully confirming the rise.
- Volume is 0.8x normal and OBV is down, so participation behind the move looks limited.
Verdict invalidated if price breaks below 120.60.
- Ideal Entry Range: 120.60 to 125.97
- Exit Target: 129.56 to 131.06
- Stop Loss protection: below 120.60
In plain English: Merck looks firm, but the chart still needs stronger momentum and volume before the move feels fully convincing.
Summary Data MRK
| Last price | 127.47 USD |
| Change 1 day / 5 days / 1 month | 0.96% / 3.12% / 6.58% |
| Trend / MA-cross | uptrend / none |
| SMA20 / SMA50 | 125.97 / 120.34 |
| RSI (14) / Stochastic %K | 56.8 / 63.1 |
| Bollinger %B / ATR | 65% / 3.63 |
| Support / Resistance 20 days | 120.60 / 129.56 |
| Data as of | 22 Juli 2026 20:30 WIB |


