LLY Stock Gains 1.97%, Momentum Weakens In Focus
On Juli 24, 2026: price 1,185.87 USD, trend sideways, RSI 55.6, support 1,127.69, resistance 1,235.56. technical analysis of lly stock.

Eli Lilly shares edged higher on the NYSE to US$1,185.87, up 1.97% on the day, but the move sits almost exactly on top of the stock’s SMA20 at US$1,186.92, which matters because it shows the market is still testing whether this rebound has enough force to turn into a cleaner trend. The price is also well above the SMA50 at US$1,125.30, so the longer tape remains constructive, yet the absence of a fresh moving-average crossover and the stock’s sideways trend label suggest this is more of a consolidation than a breakout. In plain terms, the chart says buyers have not lost control, but they also have not fully won the argument.
Trend & Price Action
The structure is balanced, not explosive. Eli Lilly is trading near the middle of its recent range, at about 54% of the 20-hour band, with support at US$1,127.69 and resistance at US$1,235.56. That positioning is important: the stock is not pressing the ceiling, but it is also not close enough to support to signal stress. The broader three-month range, from US$850.51 to US$1,249.45, shows how far the shares have already traveled, and the current price is sitting beneath the upper end of that span without yet challenging it decisively.
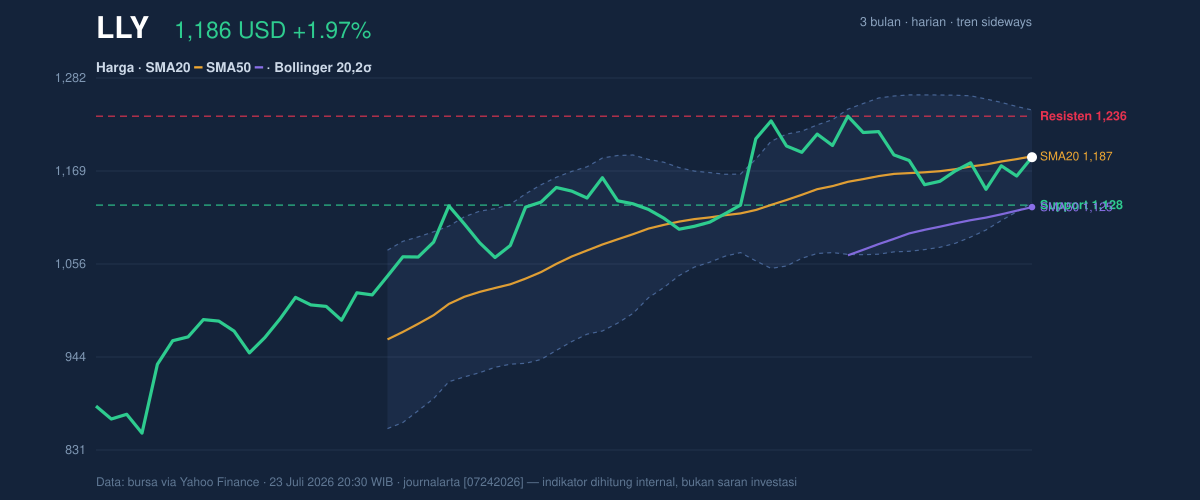
The chart also shows a subtle but meaningful detail: the SMA20 is rising at 1.34% over five days. A rising short-term average usually means the recent trend has improved, even if the stock is not sprinting. But because the price is still below the SMA20, the signal is mixed rather than bullish outright. That combination often reflects a market that is stabilizing after a pause, waiting for either a push through resistance or a drift back toward support.
Oscillators & Momentum
Momentum is steady, not stretched. The RSI at 55.6 is neutral, which tells readers the stock is neither overbought nor oversold. That is a useful signal in a name like Eli Lilly, where strong trends can persist for long periods; a neutral RSI means there is still room for the stock to move either way without immediately hitting an exhaustion zone. The Stochastic reading of 44.7 / 35.1 also sits in the middle of the field, reinforcing the idea that the shares are not flashing a reversal warning from momentum alone.
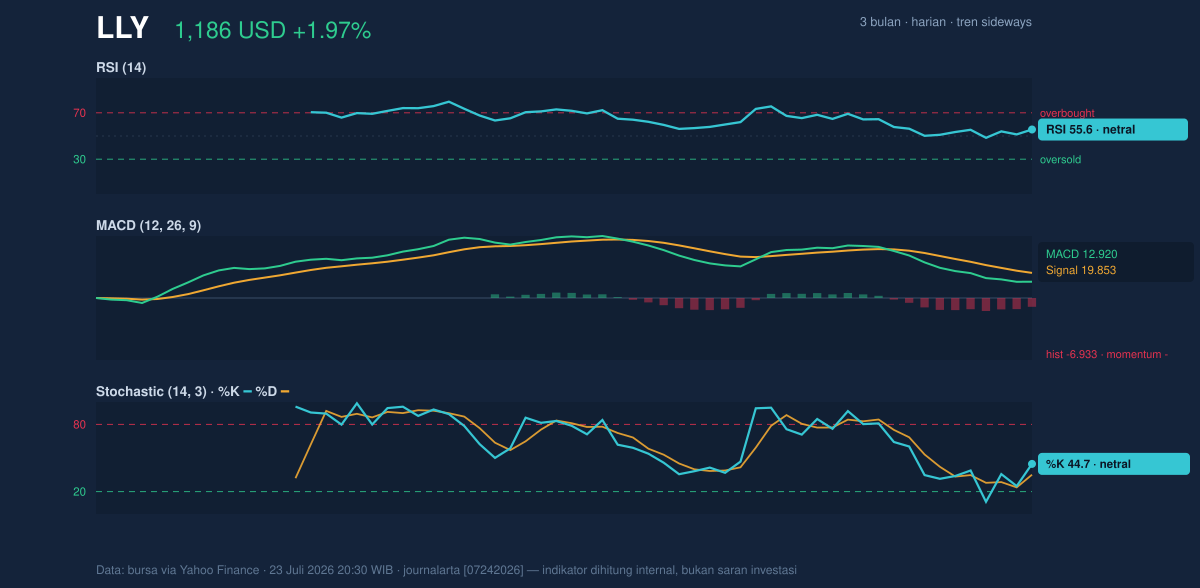
The more cautionary note comes from MACD. The MACD at 12.920 is still below the signal line at 19.853, leaving a -6.933 histogram. That negative spread means short-term momentum is trailing its recent pace, even though the stock has managed to hold gains. In practical terms, price is recovering faster than momentum is confirming, which is why the move looks steady rather than powerful. Traders often watch for MACD to turn up before they trust a fresh leg higher; right now, that confirmation has not arrived.
Volatility & Volume
Volatility is present, but not dramatic. The ATR(14) of 37.11 equals about 3.1% of the share price, which points to moderate daily movement. That matters because it frames what a normal swing might look like: the stock can move, but not in a disorderly fashion. The Bollinger Bands tell a similar story. With the middle band at US$1,186.92, the upper band at US$1,243.13 and the lower band at US$1,130.70, the price is sitting near the center of the envelope, while %B at 49% shows it is almost exactly halfway between the bands.
That is a classic “wait for direction” setup. The 9.5% Bollinger width is normal, not compressed enough to imply an imminent squeeze and not wide enough to suggest panic. Volume, however, is softer than ideal. The latest trading volume of 1,905,900 is only 0.7x the 20-session average of 2,845,580, which means the day’s advance did not come with broad participation. At the same time, OBV is rising, and that matters because on-balance volume tracks whether money is quietly accumulating over time. Put together, the tape says buyers are still present, but they are not yet showing urgency.
Key Levels & Scenarios
The immediate map is straightforward. A move through US$1,235.56 would put the stock back at the top of its recent range and bring the US$1,243.13 Bollinger upper band into focus. That would signal the market is no longer merely stabilizing, but beginning to press into the upper channel of its recent pattern. On the downside, a slip below US$1,186.92 would mean the stock has lost the short-term average that now acts as a reference point. A deeper fade toward US$1,127.69 would test whether the broader uptrend still has buyers waiting underneath.
The key signal is that Eli Lilly is not breaking down, yet it is also not breaking out. The stock is holding above the longer-term trend line, but momentum has not fully caught up with price. That makes the next move more dependent on whether volume returns near the upper range and whether the shares can reclaim the short-term average with conviction.
Technical Verdict: HOLD (wait & see)
HOLD (wait & see)
- MACD is negative versus its signal line, which means short-term momentum is still lagging even after the recent price bounce.
- RSI at 55.6 and Stochastic at 44.7 / 35.1 are neutral, so the stock is not offering a strong directional edge from oscillators.
- Volume is only 0.7x normal, so the advance lacks the participation usually needed for a convincing breakout.
- Verdict invalidated if price falls below US$1,127.69, because that would break the stated support and weaken the current range structure.
- Ideal entry range: US$1,186.92 to US$1,127.69
- Exit target: US$1,235.56 to US$1,243.13
- Stop loss protection: below US$1,127.69
In plain English, the chart says Eli Lilly is holding up, but it still needs stronger confirmation before the next move can be trusted.
Summary Data LLY
| Last price | 1,185.87 USD |
| Change 1 day / 5 days / 1 month | 1.97% / 1.43% / 6.14% |
| Trend / MA-cross | sideways / none |
| SMA20 / SMA50 | 1,186.92 / 1,125.30 |
| RSI (14) / Stochastic %K | 55.6 / 44.7 |
| Bollinger %B / ATR | 49% / 37.11 |
| Support / Resistance 20 days | 1,127.69 / 1,235.56 |
| Data as of | 23 Juli 2026 20:30 WIB |


