Momentum Weakens, AMAT Stock Gains 1.60% Today
On Juli 24, 2026: price 562.80 USD, trend sideways, RSI 49.3, support 525.70, resistance 723.00. technical analysis of amat stock. Momentum Weakens — full…

Applied Materials is trading in a market that is still trying to decide whether the recent bounce is the start of a base or just a pause inside a broader pullback. On 23 July 2026 at 20:30 WIB, the Nasdaq-listed semiconductor equipment maker changed hands at 562.80 USD, up 1.60% on the day, but still 4.44% lower over the past month, according to Yahoo Finance data sourced from the exchange.
Trend & Price Action
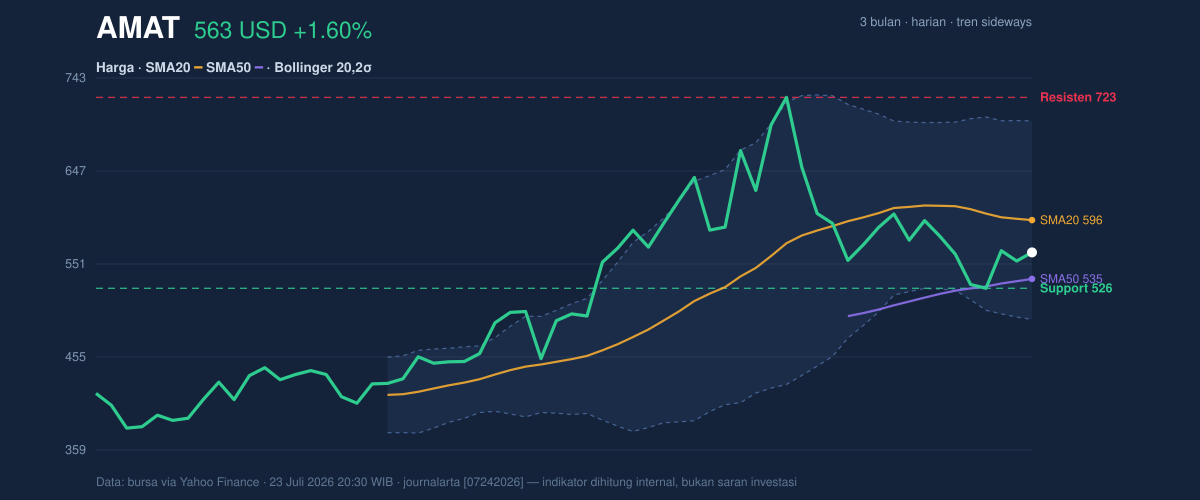
The first signal is not the daily gain, but where the stock sits relative to its moving averages. Applied Materials remains below its SMA20 at 596.17, which matters because the 20-day average is often a short-term line of trend control. When price stays under that line, rallies tend to be treated as recovery attempts rather than confirmed upswings. At the same time, the stock is still above its SMA50 at 535.38, so the medium-term structure has not broken down completely.
That puts AMAT in a classic middle zone: not weak enough to be in a full technical breakdown, but not strong enough to reclaim short-term momentum. The chart also shows a sideways trend with the SMA20 sloping down 2.36% over five days, which suggests the near-term bias has softened even though the broader price floor has held. There is no new moving-average cross, so the market has not yet produced a fresh trend signal.
The stock is trading near the lower half of its recent range. The 20-day support at 525.70 and 20-day resistance at 723.00 frame the current battle, while the price sits at roughly 19% of that range. In plain language, AMAT is much closer to the lower end than the upper end, which usually means sellers still have the burden of proof.
Oscillators & Momentum
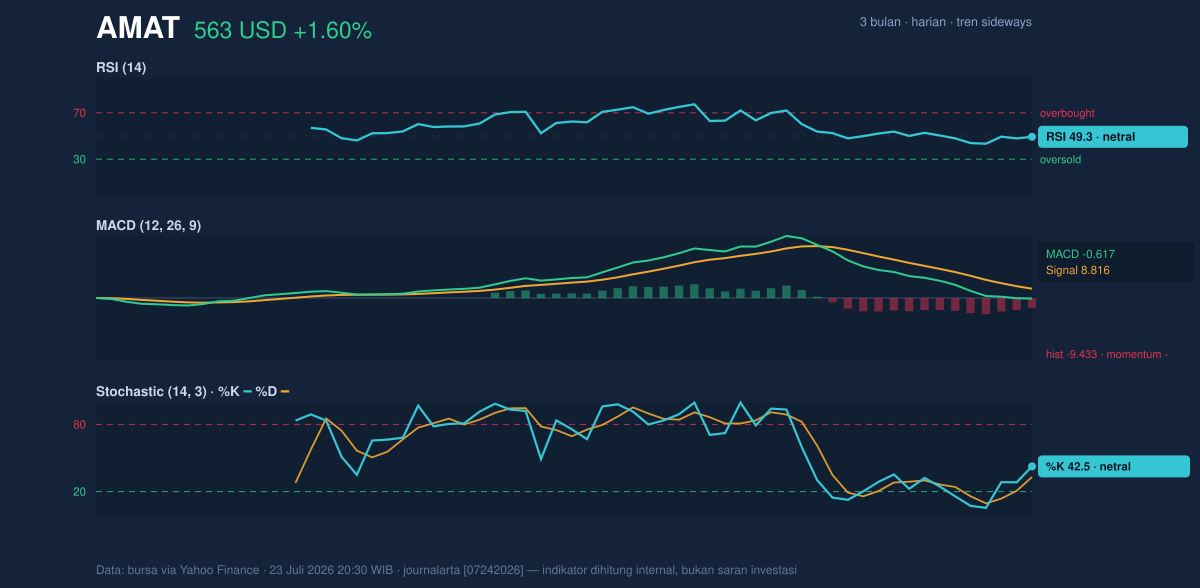
The momentum picture is mixed, and that is important because the price bounce is not yet being fully confirmed. The RSI(14) at 49.3 is neutral, which means the stock is neither stretched on the upside nor oversold. In technical terms, RSI near 50 often signals indecision: buyers and sellers are balanced, but neither side has taken control.
The Stochastic %K at 42.5 and %D at 33.1 also sit in neutral territory. Because %K is above %D, there is a mild short-term improvement in momentum, but the signal is not strong enough to override the broader picture. This is why the chart should be read as a recovery attempt rather than a clean reversal.
The most cautionary signal comes from MACD. With MACD at -0.617, the signal line at 8.816, and the histogram at -9.433, momentum remains negative. For readers unfamiliar with MACD: when the MACD line is below the signal line and the histogram is negative, price action is usually losing upward force. That does not guarantee a drop, but it does mean any advance currently lacks strong technical confirmation.
Volatility & Volume
Volatility is elevated, and that changes how investors should interpret each move. The Bollinger Bands show the upper band at 698.81, the middle band at 596.17, and the lower band at 493.54. The bandwidth is 34.4% and is described as expanding, which usually means the stock is entering a phase where larger swings are more likely. Expansion is often the market’s way of saying a quiet period is ending.
The current %B at 34% places the stock in the lower portion of the band structure, below the midline and closer to the lower band than the upper one. That does not automatically imply oversold conditions, but it does show price is still leaning to the weaker side of the range.
ATR reinforces that message. The ATR(14) at 40.59, equal to 7.2% of price, indicates high daily movement risk. In practical terms, AMAT can travel a meaningful distance in a single session, so false breaks and sharp reversals are more likely than in a calmer stock.
Volume, however, is not confirming a decisive move. Last volume was 5,688,300, well below the 20-day average of 11,081,745, or about 0.5x normal activity. That matters because breakouts and breakdowns are more credible when participation rises. The declining OBV, or on-balance volume, adds to the caution: it suggests money flow has been weaker even when price has stabilized.
Key Levels & Scenarios
The nearest support to watch is 525.70. If AMAT holds above that level, the stock can continue to build a base inside the current range. If it fails, the chart would likely shift from consolidation to renewed weakness, especially because volume is already light and OBV is falling.
On the upside, 596.17 is the first important reclaim point because it is both the SMA20 and the Bollinger middle band. A move back above it would tell traders the stock has regained its short-term average, which often improves sentiment. Above that, 723.00 is the next major resistance from the 20-day range, and then the 739.67 three-month high becomes the broader ceiling. The three-month low at 377.07 remains the deep downside reference, but the market is far above that level for now.
Technical Verdict: HOLD (wait & see)
HOLD (wait & see)
- RSI at 49.3 and Stochastic at 42.5 / 33.1 are neutral, so momentum does not yet justify a stronger directional call.
- MACD is negative with a -9.433 histogram, showing the recent bounce is still lacking confirmation.
- Price below SMA20 at 596.17 but above SMA50 at 535.38 suggests the stock is stuck between short-term weakness and medium-term support.
Invalidation: this verdict is invalidated if price falls below 525.70, because that would break the nearest support and weaken the range structure.
- Ideal Entry Range: 525.70 to 562.80, where price is testing support but has not lost the range floor.
- Exit Target: 596.17 first, then 723.00 if the stock reclaims its short-term average and extends higher.
- Stop Loss protection: below 525.70, since that is the clearest nearby support from the current chart structure.
For non-traders: AMAT is not breaking down, but it has not yet proven that the recent rise is strong enough to trust.
“It still looks like a market waiting for confirmation rather than conviction.”
Summary Data AMAT
| Last price | 562.80 USD |
| Change 1 day / 5 days / 1 month | 1.60% / 0.33% / -4.44% |
| Trend / MA-cross | sideways / none |
| SMA20 / SMA50 | 596.17 / 535.38 |
| RSI (14) / Stochastic %K | 49.3 / 42.5 |
| Bollinger %B / ATR | 34% / 40.59 |
| Support / Resistance 20 days | 525.70 / 723.00 |
| Data as of | 23 Juli 2026 20:30 WIB |


