CRM Stock Technicals Today: Gains 4.29%, Momentum Weakens
On Juli 27, 2026: price 163.66 USD, trend sideways, RSI 47.3, support 156.66, resistance 173.79. technical analysis of crm stock. CRM Stock Technicals — full…

Salesforce fell on the NYSE to 163.66 USD after the stock had closed at 156.93, with the move leaving it below SMA20 at 165.33 and still well under SMA50 at 170.18. The shares are not in a clean trend. They are drifting sideways, but the chart now shows a market that is trying to stabilize without yet proving that buyers have regained control.
Trend & Price Action
The most important signal in the price structure is that Salesforce is trading below SMA20 and below SMA50, which tells readers that the recent bounce has not yet turned into a durable recovery. In plain language, the stock is still trading under its short- and medium-term trend markers, so rallies are being treated more as tests than as confirmed breakouts.
The absence of a fresh MA-cross matters. A moving-average cross is one of the market’s shorthand signals for whether momentum is shifting from one side to the other, and no new cross means the chart has not delivered that kind of decisive handover. The slope of SMA20 is still positive at 2.14% over 5 days, which suggests the short-term base is not breaking down, but it also does not override the fact that price remains under the average itself.
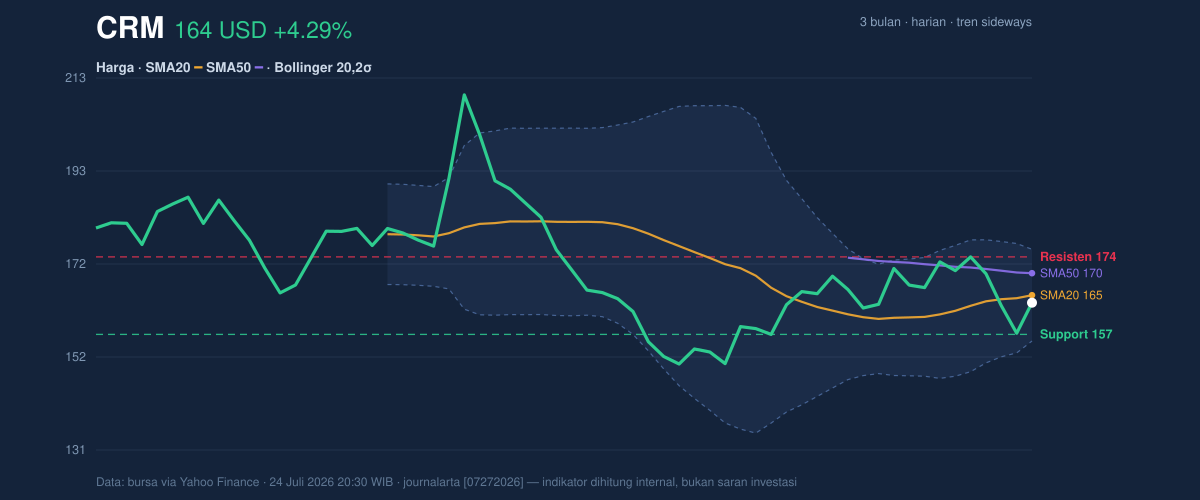
As shown in the chart, Salesforce is sitting at 41% of the 20-hour range, between support at 156.66 and resistance at 173.79. That positioning is important: it says the stock is closer to support than resistance, but not close enough to claim a clean rebound. The 3-month range, from 146.32 to 211.34, shows there is still plenty of room on both sides, yet the current price is operating in the lower half of that larger band.
Oscillators & Momentum
Momentum is mixed, and that is the key message from the oscillators. RSI at 47.3 is neutral, which means the stock is neither stretched to the upside nor washed out to the downside. That matters because neutral RSI often appears when a stock is consolidating rather than trending strongly.
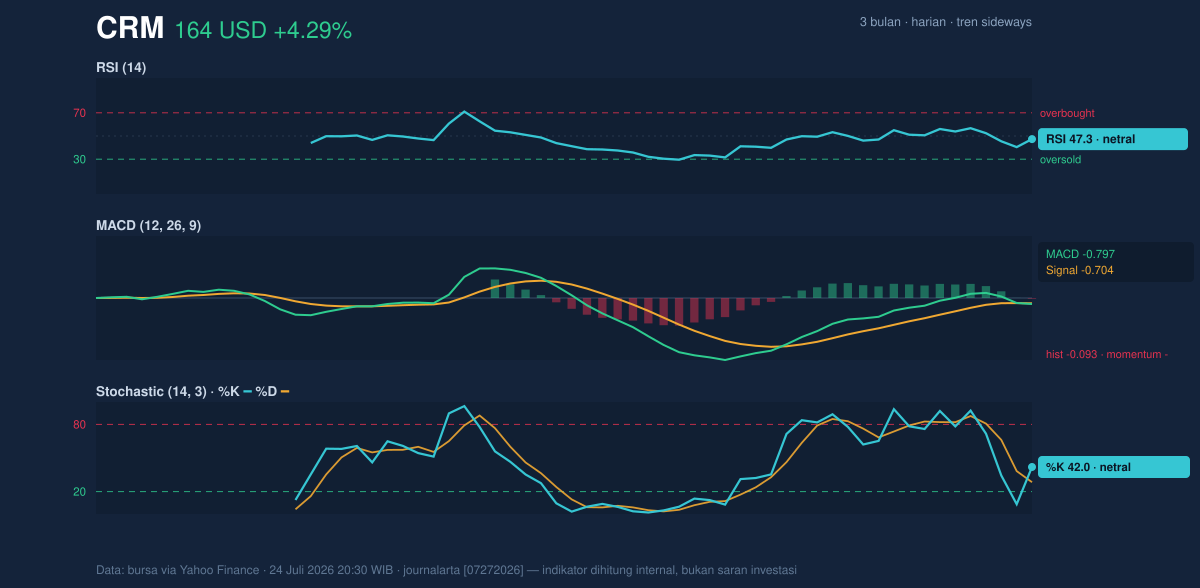
The Stochastic reading of 42.0 / 28.4 is also neutral, but it leans toward an early recovery attempt rather than a full reset. Stochastic compares where price is now with its recent range; when the faster line is above the slower line, it can hint at improving short-term tone. Here, the signal is not strong enough to call momentum positive on its own.
The more cautionary element is the MACD at -0.797, below its signal line at -0.704, with a histogram of -0.093. MACD is a trend-following momentum gauge, and negative readings mean downside momentum still has the edge, even if only slightly. The small histogram gap suggests that bearish pressure is not accelerating sharply, but it has not disappeared.
Volatility & Volume
Volatility is still elevated. The ATR(14) of 7.59, equal to 4.6% of price, means the stock can move materially in a single session. For readers, ATR is a measure of how much a share typically swings; a higher reading usually means wider intraday moves and less predictable short-term trading.
Bollinger Bands reinforce that the stock is in a normal-width consolidation rather than an explosive setup. The band width of 12.3% is described as normal, and %B at 42% places price below the middle band at 165.33 but not near the lower band at 155.19. That means Salesforce is still trading in the lower-middle zone of its recent volatility envelope, with no clear sign of an overextended move.
Volume does not yet confirm a stronger turn. Last volume was 10,896,300, below the 20-hour average of 12,656,455, or 0.9× normal. Lower-than-average turnover during a rebound often suggests that the move has not attracted broad conviction. The OBV is falling, which is another caution sign: on-balance volume tracks whether money flow is supporting price, and a downtrend there implies participation has not fully endorsed the latest bounce.
Key Levels & Scenarios
The immediate map is straightforward. 156.66 is the first support level to watch, while 173.79 is the first resistance. If price holds above support and volume improves, the stock can keep working back toward the Bollinger midline at 165.33 and then the resistance zone. If it fails to hold 156.66, the chart would expose the lower part of the 3-month range near 146.32.
The current setup is therefore less about a breakout and more about whether the recent recovery can survive the next test. A close back above SMA20 would improve the tone, but until that happens, the stock remains in a neutral-to-cautious technical posture.
Technical Verdict: HOLD (wait & see)
HOLD (wait & see) because:
- Price is below SMA20 and SMA50, so the trend has not fully turned back in favor of buyers.
- MACD remains negative, showing downside momentum still has a slight edge.
- Volume is only 0.9× normal and OBV is falling, which means the bounce lacks strong participation.
Verdict invalidated if price falls below 156.66.
- Ideal Entry Range: 156.66 to 165.33
- Exit Target: 173.79
- Stop Loss protection: below 156.66
For non-traders, this means the stock is trying to recover, but the chart has not yet shown enough proof that the recovery is lasting.
Summary Data CRM
| Last price | 163.66 USD |
| Change 1 day / 5 days / 1 month | 4.29% / -4.16% / 8.97% |
| Trend / MA-cross | sideways / none |
| SMA20 / SMA50 | 165.33 / 170.18 |
| RSI (14) / Stochastic %K | 47.3 / 42.0 |
| Bollinger %B / ATR | 42% / 7.59 |
| Support / Resistance 20 days | 156.66 / 173.79 |
| Data as of | 24 Juli 2026 20:30 WIB |


