HD Stock Analysis: Gains 2.55%, Momentum Weakens
On Juli 27, 2026: price 332.98 USD, trend sideways, RSI 47.9, support 324.71, resistance 357.90. technical analysis of hd stock. HD Stock Analysis — full…

Home Depot’s shares rose to 332.98 on the NYSE, up 2.55% from the previous close of 324.71, but the move still leaves the stock below its short-term trend line, a sign that buyers have not yet fully wrestled back control. As shown in the chart, the price is sitting in the lower quarter of its recent trading band, which means the rebound is real but still fragile: the market has bounced, yet it has not reclaimed the level that would normally signal a cleaner recovery.
Trend & Price Action
The broader setup remains sideways, with the SMA20 at 341.61 still above the share price and sloping down 0.28% over the past 5 days. That matters because the 20-day average is often treated as a short-term “fair value” line; trading below it suggests recent prices have been weaker than the recent average, even after today’s gain. At the same time, the SMA50 at 327.42 sits just below the current price, so the stock is not in a full breakdown. Instead, it is caught between a fading short-term trend and a firmer medium-term base. There is no new MA-cross, which means the chart has not produced a fresh trend confirmation in either direction.
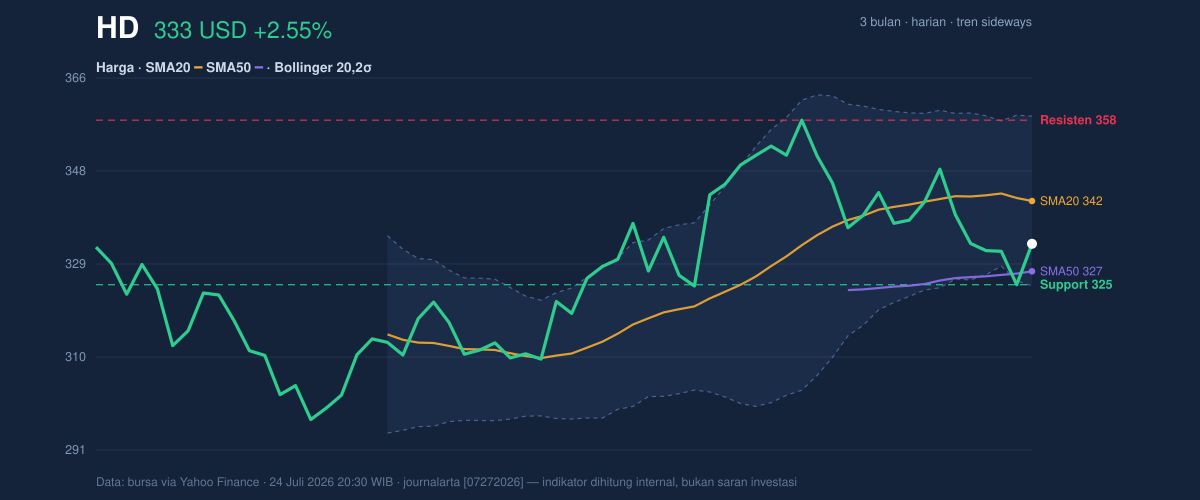
The price is also well inside the year’s recent swing area, with the 3-month high at 358.85 and the 3-month low at 289.10. That range tells a clear story: Home Depot has recovered from its lows, but it is still trading below the upper end where momentum would look more convincing.
A bounce is not the same as a breakout.
Oscillators & Momentum
The momentum signals are mixed rather than bullish. RSI at 47.9 is neutral, which usually means the stock is neither stretched on the upside nor washed out on the downside. That is important because it leaves room for either direction, but it also confirms the market is waiting for a stronger catalyst. The Stochastic %K at 30.7 and %D at 16.4 are also neutral, though the lower %D shows the faster line is still trying to recover from weaker conditions. In plain language, short-term buying pressure has improved, but it has not yet turned into a decisive momentum turn.
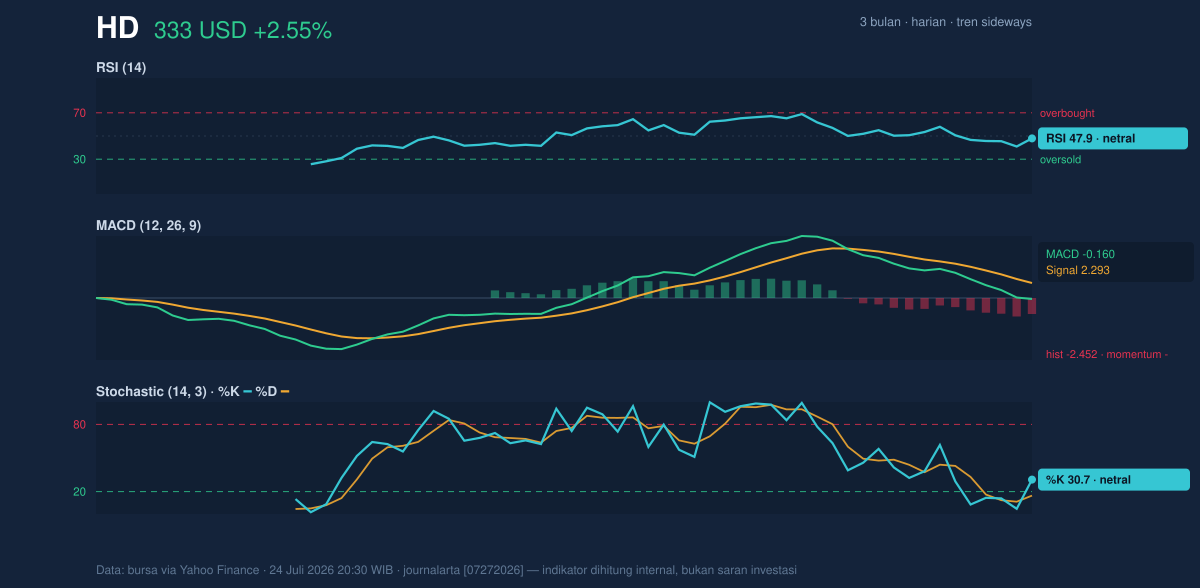
The clearest warning comes from the MACD at -0.160, with the signal line at 2.293 and the histogram at -2.452. MACD measures whether recent price action is gaining or losing speed; a negative histogram means momentum is still running below its signal trend. So even though the share price bounced on the day, the underlying impulse remains negative. That is the kind of divergence traders watch closely: price can lift first, but momentum needs to follow or the move often fades.
Volatility & Volume
Volatility is moderate, not extreme. The ATR(14) at 9.02 equals about 2.7% of the share price, which suggests normal daily movement rather than panic trading. The Bollinger Bands also point to a stock that is not in a volatility squeeze: the band width is 10.0%, described as normal, and the price sits at %B 25%. That means Home Depot is trading closer to the lower band than the middle or upper band, reinforcing the idea that the stock is still under short-term pressure even after the rebound. The lower band at 324.48 is especially notable because the last price is only modestly above it.
Volume does not yet confirm a strong reversal. The latest volume of 3,874,500 was just under the 20-day average of 4,013,100, about 1.0× normal. In other words, the move higher happened without unusually heavy participation. That matters because rallies backed by expanding volume tend to be more durable; when volume is merely average and OBV is falling, it suggests money flow is still leaving the stock more than entering it.
The chart is showing repair, not conviction.
Key Levels & Scenarios
The nearest line in the sand is support at 324.71, effectively aligned with the recent low and just above the Bollinger lower band at 324.48. If that area holds, the stock can continue to stabilize inside its current range. If it fails, the chart would likely lose the base that has been supporting the rebound.
On the upside, resistance at 357.90 is the first major ceiling, sitting just below the 3-month high of 358.85. That is the zone where the market has already shown reluctance to push through. A move toward that band would need stronger momentum confirmation than the stock has now, especially with the price still below the SMA20 at 341.61 and MACD negative.
Technical Verdict: HOLD (wait & see)
HOLD (wait & see) is the clearest technical reading because the chart shows a rebound without full confirmation: price remains below the SMA20, MACD is negative, and OBV is still declining even though the stock has bounced off the lower part of its range. The neutral RSI and Stochastic say the stock is not oversold enough to force a reversal, while the Bollinger position near the lower band shows room for stabilization but not yet a confirmed trend change.
- Entry Range: 324.71 to 341.61
- Exit Target: 357.90 to 358.85
- Stop Loss protection: below 324.48
This verdict is invalidated if price falls below 324.48, because that would mean the lower-band support and recent floor are no longer holding.
For non-traders: the stock has stopped falling for now, but it has not yet proven that the recovery is strong enough to trust.
Summary Data HD
| Last price | 332.98 USD |
| Change 1 day / 5 days / 1 month | 2.55% / -1.74% / -3.48% |
| Trend / MA-cross | sideways / none |
| SMA20 / SMA50 | 341.61 / 327.42 |
| RSI (14) / Stochastic %K | 47.9 / 30.7 |
| Bollinger %B / ATR | 25% / 9.02 |
| Support / Resistance 20 days | 324.71 / 357.90 |
| Data as of | 24 Juli 2026 20:30 WIB |



