AIA Stock Analysis: Drops 0.26%, Testing Key Resistance
On Juli 29, 2026: price 77.90 HKD, trend sideways, RSI 59.4, support 71.45, resistance 78.60. technical analysis of aia stock. AIA Stock Analysis — full…

AIA Group ended at HKD 77.90, down 0.26% on the day but still up 2.84% over five days and 10.03% over one month, according to data from the Hong Kong exchange via Yahoo Finance. The tape shows a stock that has recovered well from its recent base, yet is now pressing into the upper part of its short-term range. That matters because the current setup is no longer about whether buyers exist; it is about whether they still have enough conviction to push through nearby resistance without fresh participation.
Trend & Price Action
The broader trend is still described as sideways, even though the SMA20 at HKD 74.68 is rising at a 1.68% pace over five days and the share price remains above the SMA20. In plain terms, the stock is trading above its recent average, which usually signals that the latest price action is stronger than the last month’s baseline. But sideways trend language tells you the market has not yet committed to a full directional breakout. The absence of a fresh MA-cross supports that reading: there is no new moving-average signal to declare a decisive trend change.
The key chart point is that AIA is sitting close to the top of its near-term range. As shown in the chart, the stock is near the 20-hour resistance at HKD 78.60 and trading at about 90% of its recent range. That positioning is constructive, but it also means the easy part of the move may already be behind it. The upper Bollinger band at HKD 79.09 is only slightly above the market, so the next push higher would need to absorb resistance quickly rather than drift upward slowly.
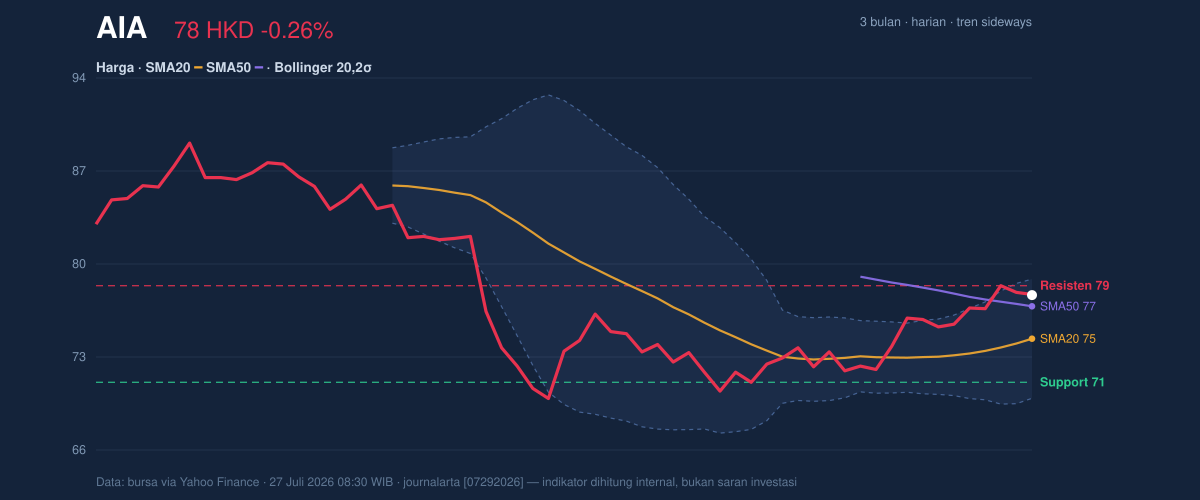
At the same time, the broader 3-month range still leaves room on both sides, with the stock well below the 3-month high of HKD 89.95 and above the 3-month low of HKD 69.05. That gap tells a simple story: the recovery is real, but the stock has not yet reclaimed the kind of price territory that would signal a completed trend reversal.
Oscillators & Momentum
The momentum picture is mixed, and that mix is important. The RSI at 59.4 is neutral, which means the stock is not technically stretched on that measure. RSI is the market’s “temperature check”: near 50 suggests balance, while much higher readings can imply enthusiasm is starting to run ahead of itself. A reading just under 60 says momentum is positive, but not yet extreme.
The stronger warning comes from the stochastic oscillator, where %K at 90.1 and %D at 93.2 both sit in overbought territory. That does not automatically mean a drop is imminent. It means the stock has been advancing fast enough that short-term traders may already be crowded into the same side of the trade. When stochastic stays elevated while price is near resistance, the market often needs either a breakout with volume or a pause to reset.
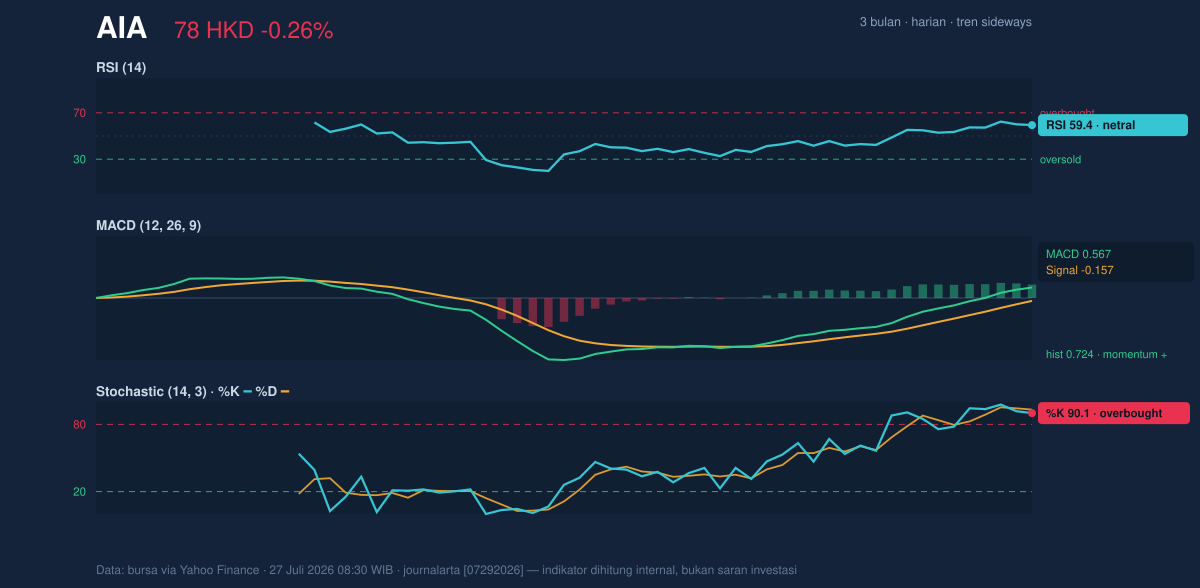
The MACD at 0.567, with the signal line at -0.157 and a histogram of 0.724, is the clearest bullish element in the setup. MACD measures whether shorter-term price momentum is outrunning longer-term momentum. A positive reading with a positive histogram means upward momentum is still intact and has not yet rolled over. In other words, the stock is not showing a clean reversal signal; it is showing a still-live advance that may be entering a more fragile stage.
Volatility & Volume
Volatility is moderate rather than explosive. The ATR(14) of 1.97, equal to 2.5% of price, suggests typical daily movement is manageable and not unusually wide. That matters because a stock with moderate ATR can consolidate just below resistance without a dramatic shakeout. The Bollinger band width of 11.8% is described as normal, so there is no squeeze implying a coming volatility burst, and no expansion strong enough to suggest panic or euphoria.
The %B at 87% is the more revealing signal. %B shows where price sits within the Bollinger envelope, and a reading this high means the stock is trading near the upper edge of its recent statistical range. That is often a sign of strength, but also of limited immediate upside unless buyers can force a clean break above the band.
Volume is the missing confirmation. Last volume was 10,413,318, well below the 20-day average of 24,767,042, or about 0.4× normal. Thin participation on an advance can mean the move is being carried by fewer hands than usual. The OBV is rising, which is supportive because on-balance volume tracks whether money is flowing in over time. Still, when OBV improves while daily volume is light, the message is usually “accumulation is present, but not yet forceful.”
Key Levels & Scenarios
The immediate structure is straightforward. HKD 78.60 is the first level to watch on the upside, while HKD 79.09 marks the upper Bollinger boundary. A move through both would indicate the stock is no longer just testing resistance, but trying to establish a higher trading zone. On the downside, HKD 74.68 is the SMA20 and the Bollinger midpoint, making it the most important line of support for the current rebound. Below that, HKD 71.45 is the 20-hour support, and a loss of that area would weaken the short-term structure materially.
Technical Verdict: HOLD (wait & see)
HOLD (wait & see) fits the current technical picture because the stock has positive momentum, but it is also sitting close to resistance with overbought short-term oscillators and below-average volume.
- MACD remains positive, so the trend impulse is still alive.
- Stochastic is overbought, which raises the odds of a pause or pullback near resistance.
- Volume is only 0.4× average, so the latest rise lacks strong participation confirmation.
Verdict invalidated if price breaks below HKD 71.45.
- Ideal Entry Range: HKD 74.68 to HKD 75.00
- Exit Target: HKD 78.60 to HKD 79.09
- Stop Loss: below HKD 71.45
For non-traders, this means the stock looks healthy, but it is not yet showing the kind of volume-backed breakout that would remove short-term hesitation.
Summary Data AIA
| Last price | 77.90 HKD |
| Change 1 day / 5 days / 1 month | -0.26% / 2.84% / 10.03% |
| Trend / MA-cross | sideways / none |
| SMA20 / SMA50 | 74.68 / 77.07 |
| RSI (14) / Stochastic %K | 59.4 / 90.1 |
| Bollinger %B / ATR | 87% / 1.97 |
| Support / Resistance 20 days | 71.45 / 78.60 |
| Data as of | 27 Juli 2026 08:30 WIB |


