CRM Testing Key Resistance: Stock Gains 4.55% (Juli 29, 2026)
On Juli 29, 2026: price 181.50 USD, trend sideways, RSI 60.7, support 156.66, resistance 181.50. technical analysis of crm stock. CRM Testing Key Resistance —…

Salesforce (CRM) rose to 181.50 on the NYSE on 28 July 2026, extending a short-term rebound that lifted the stock 4.55% in one day and 14.92% over one month, according to Yahoo Finance data. The move matters because it pushed the shares to the top of the recent trading range, where momentum can either force a breakout or stall if buyers run out of room.
Trend & Price Action
The chart shows a stock that is still labeled sideways, but that description now sits alongside a clear improvement in price structure. Salesforce is trading above SMA20 at 167.27 and above SMA50 at 170.61, which means the short-term price is no longer fighting its recent average cost base. In plain language, that often signals that sellers who dominated earlier are losing control, even if the broader trend has not fully turned into a sustained uptrend.
There is no new MA-cross, so the market has not yet produced the cleaner signal that comes when a shorter average decisively overtakes a longer one. That matters because it keeps the move in the “improving but not confirmed” category. The SMA20 slope of 2.01% over 5 days shows the short average is rising, which is a constructive sign, but the sideways label suggests the stock still needs more follow-through before traders can call the structure decisively directional.
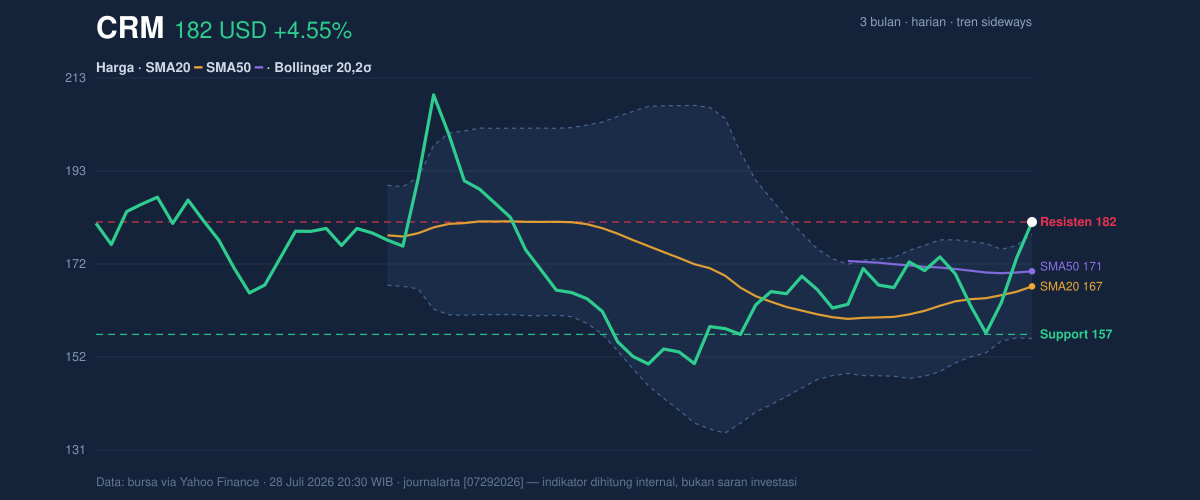
The price is also sitting at 100% of the 20-hour range, with support at 156.66 and resistance at 181.50. That positioning is important: when a stock is pinned at the top of its recent band, it is either preparing for a breakout or showing the first signs of exhaustion. The broader 3-month high of 211.34 and 3-month low of 146.32 frame the recent rally as a recovery from the lower half of the range, not a full return to prior highs.
Oscillators & Momentum
Momentum is positive, but it is not perfectly balanced. The RSI at 60.7 is still neutral, which suggests the stock has room to extend without yet being technically stretched. That is the healthier reading for a rising stock: it implies the rally has gained traction without immediately entering the kind of overbought zone that often triggers fast reversals.
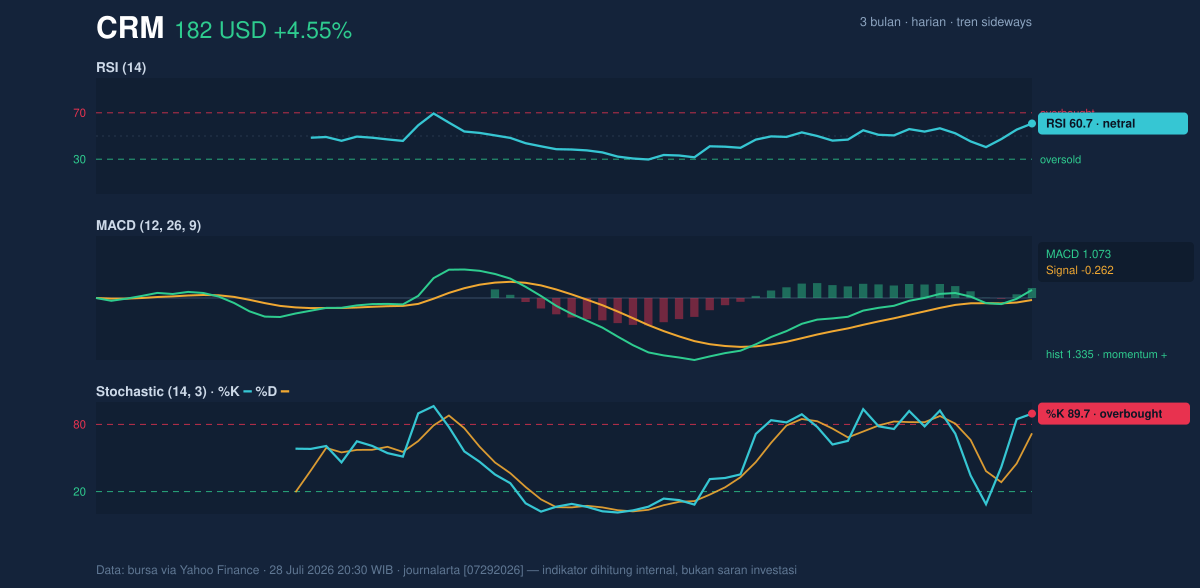
The caution comes from the Stochastic %K at 89.7 versus %D at 72.1, which is overbought. Stochastic is a faster oscillator than RSI, so it often flashes warning signals earlier. In this case, it says the stock has moved quickly enough that near-term pullbacks become more likely, even if the bigger trend has not broken. The message is not that the rally is over, but that the stock may need to pause before it can move higher again.
The MACD at 1.073 with a signal line at -0.262 and histogram at 1.335 is the strongest momentum evidence in the data. MACD is positive and expanding, which means the recent price acceleration is still being confirmed by trend-following momentum. In practical terms, this tells investors that the rally is not just a one-day spike; it has internal force behind it.
Volatility & Volume
Volatility is elevated. The ATR(14) of 8.50, equal to 4.7% of price, means the stock can swing meaningfully in either direction on a normal day. That is important because a stock trading near resistance with high ATR can overshoot levels quickly, but it can also reverse sharply if momentum fades. The Bollinger Bands help explain that tension: the upper band at 178.80 has already been exceeded, with %B at 112%, which means the shares are trading outside the usual statistical envelope. That is a classic sign of strength, but also of short-term overstretch.
The Bollinger band width of 13.8% is described as normal, so this is not yet a squeeze setting up an explosive move from compressed volatility. Instead, the tape looks like a stock that has already expanded upward and is now testing how much more buyers can sustain. Volume supports that reading. Last trade volume of 17,157,200 was about 1.4× normal, and OBV is rising, showing participation is broadening rather than fading. When price rises on heavier volume and OBV climbs, the move is more likely to be real than purely mechanical.
Key Levels & Scenarios
The immediate battle line is clear. 181.50 is both the latest price and the current resistance reference in the 20-hour range, so it is the level that tells the story right now. A sustained move above that area would suggest the stock is trying to convert a short-term rally into a more durable advance. If it fails to hold that zone, the market may rotate back toward the prior support shelf at 156.66, where buyers previously emerged.
The Bollinger structure adds another layer: 178.80 is the upper band, so price above it is already stretched. That means any further upside would likely need continued volume and MACD support to avoid becoming a false breakout. On the downside, a move back under 167.27 would put the stock back below SMA20, weakening the current improvement and signaling that the recent push has lost short-term momentum.
Technical Verdict: HOLD (wait & see)
HOLD (wait & see)
- MACD is positive and the histogram is expanding, which supports the current rebound.
- Price is above SMA20 and SMA50, showing short-term strength relative to recent averages.
- Stochastic is overbought and price is already above the upper Bollinger band at 178.80, so the move is stretched near resistance.
Verdict invalidated if price breaks below 167.27.
- Ideal Entry Range: 167.27 to 170.61
- Exit Target: 181.50 and, if strength extends, the next reference is the 3-month high at 211.34
- Stop Loss protection: 156.66
For non-traders, that means the stock looks stronger than it did a few weeks ago, but it is already stretched enough that confirmation is still needed before the move can be trusted.
The latest recorded volume was 17,157,200.
Summary Data CRM
| Last price | 181.50 USD |
| Change 1 day / 5 days / 1 month | 4.55% / 6.73% / 14.92% |
| Trend / MA-cross | sideways / none |
| SMA20 / SMA50 | 167.27 / 170.61 |
| RSI (14) / Stochastic %K | 60.7 / 89.7 |
| Bollinger %B / ATR | 112% / 8.50 |
| Support / Resistance 20 days | 156.66 / 181.50 |
| Data as of | 28 Juli 2026 20:30 WIB |


