KO Stock Gains 5.00%, Testing Key Resistance In Focus
On Juli 29, 2026: price 88.27 USD, trend uptrend, RSI 66.8, support 81.17, resistance 88.27. technical analysis of ko stock. KO Stock Gains — full details here.

Coca-Cola shares finished at 88.27 USD on 28 July 2026, up 5.00% from the previous close of 84.07, and the move leaves the stock pressing against the top of its recent range. That matters because KO is not just rising; it is doing so with price above the SMA20 at 83.08 and above the SMA50 at 81.59, a setup that typically signals buyers are still controlling the tape rather than merely reacting to a one-day headline. The chart also shows the stock sitting at the upper edge of its Bollinger band structure, which often means momentum is strong but the margin for error is getting thinner.
Trend & Price Action
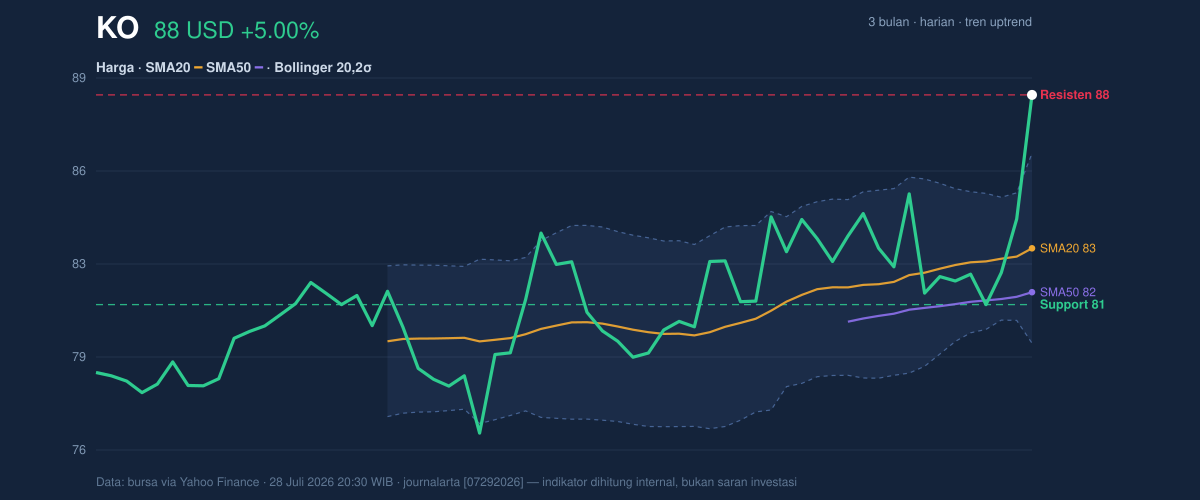
The broader structure remains constructive: KO is in an uptrend, with the SMA20 slope rising 0.69% over 5 days. That slope is important because it shows the short-term trend is not flat; it is still improving. The stock is also trading well above its moving averages, which suggests recent demand has been strong enough to pull price away from its average trading zone. In plain terms, the market is paying up for the shares rather than waiting for a discount.
The current position is more revealing than the raw gain. KO is now at 100% of the 20-hour range, with support at 81.17 and resistance at 88.27. When a stock closes right at the top of its short-term range, it usually signals either accumulation near a breakout point or exhaustion after a fast run. The difference will be visible in whether price can hold this area on follow-through volume.
A short distance remains to the 3-month high of 90.22, while the 3-month low sits at 76.81. That range frames the current move: KO is not in a breakout far beyond prior highs, but it is close enough that traders will be watching whether the stock can convert a near-high into a new platform.
Oscillators & Momentum
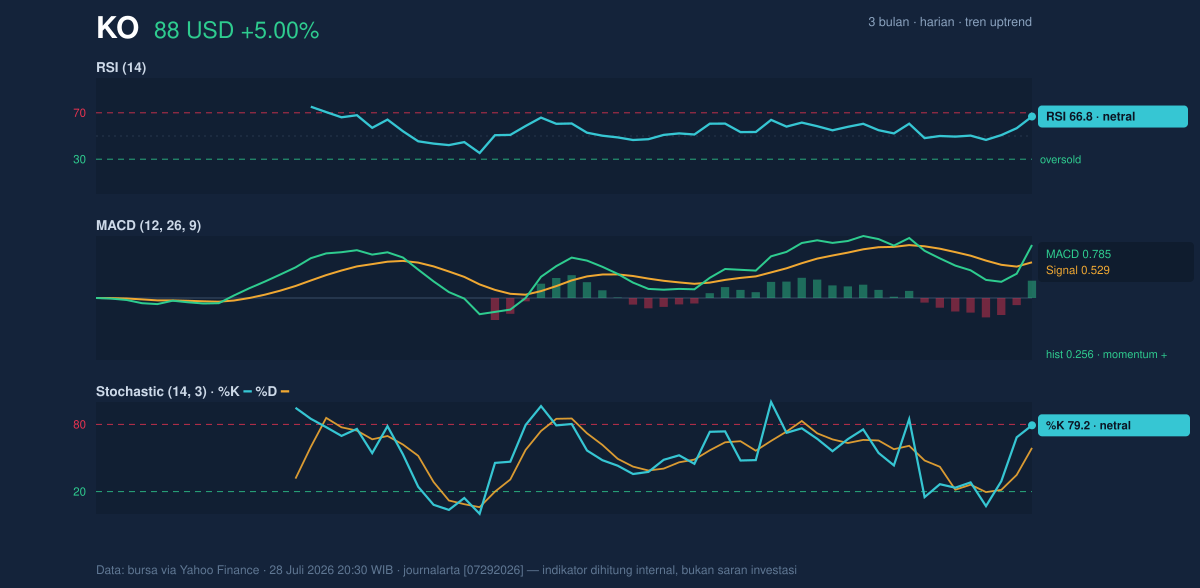
The momentum picture is supportive, though not euphoric. RSI(14) at 66.8 is labeled neutral in the dataset, but it sits close to the upper end of the range, which usually means the stock has strong momentum without yet showing a classic overbought warning. Stochastic %K at 79.2 and %D at 59.0 also lean firm, with %K above %D, a sign that recent price action has been stronger than the short-term average. That alignment matters because it suggests the move is still being confirmed rather than fading.
The strongest momentum signal comes from MACD. MACD at 0.785 is above the signal line at 0.529, with a positive histogram of 0.256. In practical terms, that means upward momentum is still expanding, not just present. When MACD stays above its signal line and the histogram is positive, it often indicates the trend has room to continue unless price loses support.
This is where the story becomes more nuanced. Momentum is positive, but it is also getting stretched. That is not a bearish signal by itself; it simply means the stock is no longer early in the move, and the next phase depends more on follow-through than on fresh enthusiasm.
Volatility & Volume
The Bollinger setup adds an important layer. KO is trading above the upper band at 86.29, with %B at 131%, which means price has pushed beyond the statistical envelope of its recent 20-day volatility. That often happens in strong trends, but it also warns that the move is extended relative to recent trading patterns. The band width of 7.7% is narrowing, a squeeze that often precedes a larger move. Put together, the message is clear: the stock is stretched, but volatility compression suggests the next move could still be meaningful if price keeps holding above the band.
Volume confirms participation. 34,964,200 shares traded, roughly 2.0x the 20-hour average of 17,461,190, and OBV is rising. That combination is one of the cleaner signs in technical analysis because it shows the advance is being supported by actual participation, not just thin trading. Rising OBV means cumulative volume is flowing in the same direction as price, which tends to strengthen the credibility of the trend.
The signal is simple.
Key Levels & Scenarios
The chart points to a narrow but important decision zone. Immediate resistance is 88.27, which is now also the latest closing level, so a sustained move above this area would be the first sign that KO is attempting to turn short-term resistance into support. On the downside, support at 81.17 and the SMA20 at 83.08 form the first cushion. If price slips back under the moving average, it would suggest the recent push was more of an extension than a durable trend step.
The Bollinger middle band at 83.08 is especially important because it aligns with the SMA20. That overlap often acts like a line between trend continuation and trend fatigue. A hold above it keeps the bullish structure intact; a break below it would weaken the case that the latest move is still in control.
Technical Verdict: HOLD (wait & see)
HOLD (wait & see)
- MACD is positive and above its signal line, which supports the current uptrend.
- Price is above SMA20 and SMA50, confirming a constructive trend structure.
- Volume is 2.0x average and OBV is rising, showing real participation behind the move.
- Verdict invalidated if price falls below 81.17, which would put the short-term support shelf at risk and weaken the trend.
- Ideal Entry Range: 83.08 to 86.29
- Exit Target: 90.22
- Stop Loss protection: 81.17
In plain English, the stock is strong, but it is already close to a resistance zone, so the cleaner read is to wait for confirmation rather than chase the move.
Summary Data KO
| Last price | 88.27 USD |
| Change 1 day / 5 days / 1 month | 5.00% / 7.69% / 6.80% |
| Trend / MA-cross | uptrend / none |
| SMA20 / SMA50 | 83.08 / 81.59 |
| RSI (14) / Stochastic %K | 66.8 / 79.2 |
| Bollinger %B / ATR | 131% / 1.99 |
| Support / Resistance 20 days | 81.17 / 88.27 |
| Data as of | 28 Juli 2026 20:30 WIB |



