UNH Stock Technicals Today: Gains 2.67%, Momentum Weakens
On Juli 29, 2026: price 428.79 USD, trend uptrend, RSI 55.9, support 415.63, resistance 436.35. technical analysis of unh stock. UNH Stock Technicals — full…

UnitedHealth Group shares rose to 428.79 USD on the NYSE on 28 July 2026, a move that left the stock above its short-term trend line but still below the upper edge of its recent trading band. The stock is not breaking out cleanly yet. What matters now is that the price is holding above the 20-day average while momentum indicators remain mixed, a combination that often signals consolidation inside an uptrend rather than a fresh acceleration.
Trend & Price Action
As shown in the chart, UNH is still in an uptrend, with the 20-day simple moving average rising at 0.52% over 5 days. That slope matters because it shows the short-term trend is still pointing higher, even if the pace is not especially aggressive. The share price is also trading above both the SMA20 at 424.89 and the SMA50 at 408.52, which tells investors the stock remains above both its near-term and medium-term average cost basis.
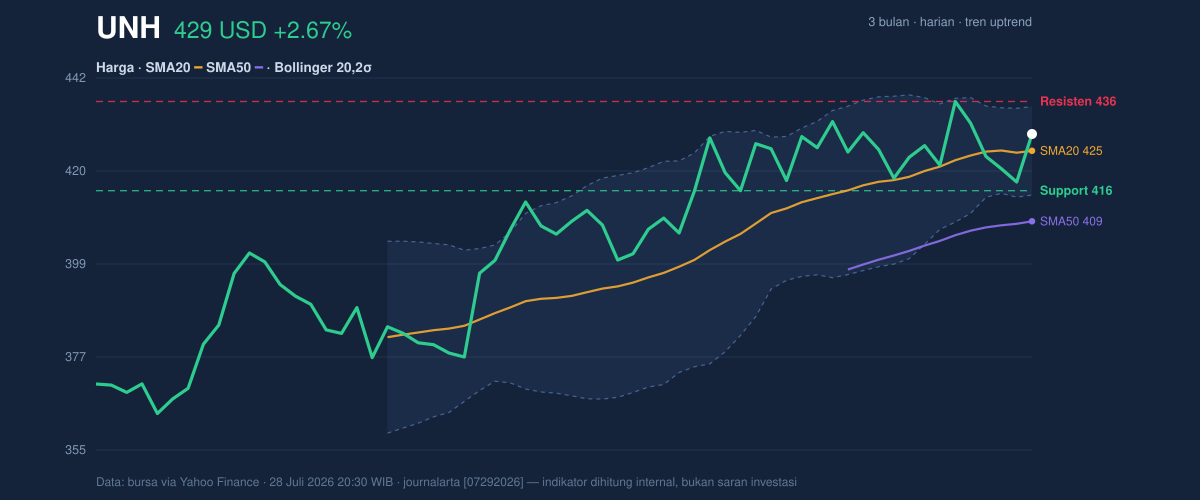
The absence of a new moving-average crossover is also important. It means the chart is not flashing a fresh trend-change signal; instead, the existing structure remains intact. In plain terms, the stock is still behaving like an established leader that is pausing rather than reversing. The price sits at 64% of its 20-hour range, which places it closer to the upper half of the recent band without being stretched to an extreme. That positioning is constructive, but not yet decisive.
Oscillators & Momentum
Momentum is where the picture becomes more cautious. The RSI at 55.9 is neutral, which means the stock is neither overbought nor oversold. That usually suggests there is room for further gains, but it does not confirm that buyers are in control. The Stochastic %K at 33.1 and %D at 19.0 also sit in neutral territory, with the faster line above the slower one, hinting at some near-term recovery pressure but not a strong momentum surge.
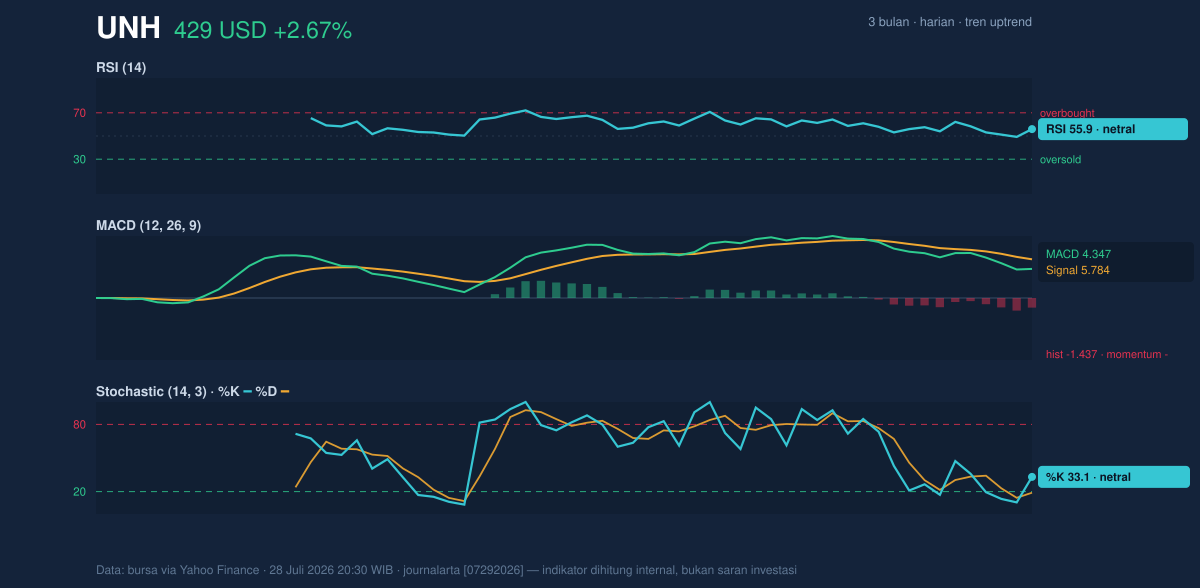
The more important caution flag is the MACD at 4.347 versus its signal line at 5.784, leaving a negative histogram of -1.437. That setup means the recent price trend has been losing internal strength, even while the broader chart remains positive. In practical terms, price can still hold up while momentum cools; that often happens before either a renewed push higher or a sideways stretch. For now, the oscillators are not confirming a breakout.
Volatility & Volume
Volatility is moderate, with ATR(14) at 13.48, equal to 3.1% of price. ATR, or average true range, measures how much the stock typically moves in a day. A reading like this suggests UNH is active enough to move meaningfully, but not in a disorderly way. The Bollinger Bands add a useful clue: the upper band is 435.15, the middle band is 424.89, and the lower band is 414.63. Price is trading at %B 69%, which means it is in the upper portion of the band structure, but still below the top band.
The key detail is that the band width has narrowed to 4.8%, a squeeze that often precedes a larger move. A squeeze does not predict direction by itself; it tells traders that volatility has compressed and the market may soon choose a side. With the MACD still negative, the chart is not yet confirming which way that choice will go.
Volume offers a modest positive signal. The latest volume of 5,917,300 was roughly 1.0× normal against the 20-day average of 5,745,150, so the move higher was not happening on weak participation. More importantly, OBV is rising, which indicates money flow has been steadily improving. OBV, or on-balance volume, tracks whether volume is accumulating on up days or down days; a rising line usually supports the idea that buyers are quietly absorbing supply.
Key Levels & Scenarios
The nearest support sits at 415.63, while resistance is at 436.35. Those levels frame the current debate. If UNH can clear the resistance zone and hold above it, the chart would begin to resolve the Bollinger squeeze in a more constructive way. If it fails to do that, the stock may drift back toward the middle band at 424.89 or the support area near 415.63.
The broader 3-month range also helps define the context: 461.62 remains the recent high, and 358.25 the low. That wide range shows UNH has already absorbed a substantial amount of volatility this quarter, so the current setup is more about whether the stock can extend its recovery than whether it is starting from a blank slate.
Technical Verdict: HOLD (wait & see)
HOLD (wait & see) fits best because the trend is positive, but momentum is not fully aligned.
- Reason 1: Price is above the SMA20 at 424.89 and SMA50 at 408.52, and the SMA20 slope is rising, which supports the trend.
- Reason 2: The Bollinger Band squeeze at 4.8% suggests a larger move may be building, but direction is not confirmed.
- Reason 3: The MACD histogram at -1.437 shows momentum is still negative even as OBV is rising, creating a split message.
- Invalidation: this verdict is invalidated if price falls below 415.63, which would put the stock back into the lower part of its recent range.
- Ideal Entry Range: 415.63 to 424.89
- Exit Target: 436.35
- Stop Loss protection: below 414.63
In plain English: the chart says UNH is holding up, but it has not yet proved that the next move will be stronger than the last one.
The next technical test is whether the shares can press through 436.35 after the squeeze in volatility.
Summary Data UNH
| Last price | 428.79 USD |
| Change 1 day / 5 days / 1 month | 2.67% / -1.73% / 2.14% |
| Trend / MA-cross | uptrend / none |
| SMA20 / SMA50 | 424.89 / 408.52 |
| RSI (14) / Stochastic %K | 55.9 / 33.1 |
| Bollinger %B / ATR | 69% / 13.48 |
| Support / Resistance 20 days | 415.63 / 436.35 |
| Data as of | 28 Juli 2026 20:30 WIB |



