AMZN Stock Analysis: Gains 15.32%, Testing Key Resistance
On Agustus 3, 2026: price 271.58 USD, trend sideways, RSI 67.7, support 226.65, resistance 271.58. technical analysis of amzn stock. AMZN Stock Analysis — full…

Amazon shares on Nasdaq jumped to 271.58 dollars, according to Yahoo Finance data at 31 July 2026 20:30 WIB, after a session that pushed the stock to the top of its recent range. The move is sharp. But the chart is sending a mixed message: price strength is now running ahead of some of the slower trend and participation signals.
Trend & Price Action
Amazon is still described as sideways, and that matters because the latest surge has not yet changed the broader structure. The price is above the SMA20 at 243.86 and also above the SMA50 at 246.63, which usually tells traders the short-term tape has improved. Yet the note that there is no new MA-cross means the move has not been confirmed by a fresh shift in the moving-average relationship. In plain terms, the stock has bounced strongly, but the underlying trend has not fully reset into a cleaner uptrend.
That tension is visible in the range data. Amazon is trading at 100% of its 20-hour range, with support at 226.65 and resistance at 271.58. It is also pressing against the 3-month high of 278.56, leaving limited room before the next technical ceiling. The stock has gained 15.32% in one day, 17.00% in five days, and 11.91% over one month, which is enough to show powerful buying interest. But the speed of the move also raises the risk that some of the advance is stretched rather than steadily built.
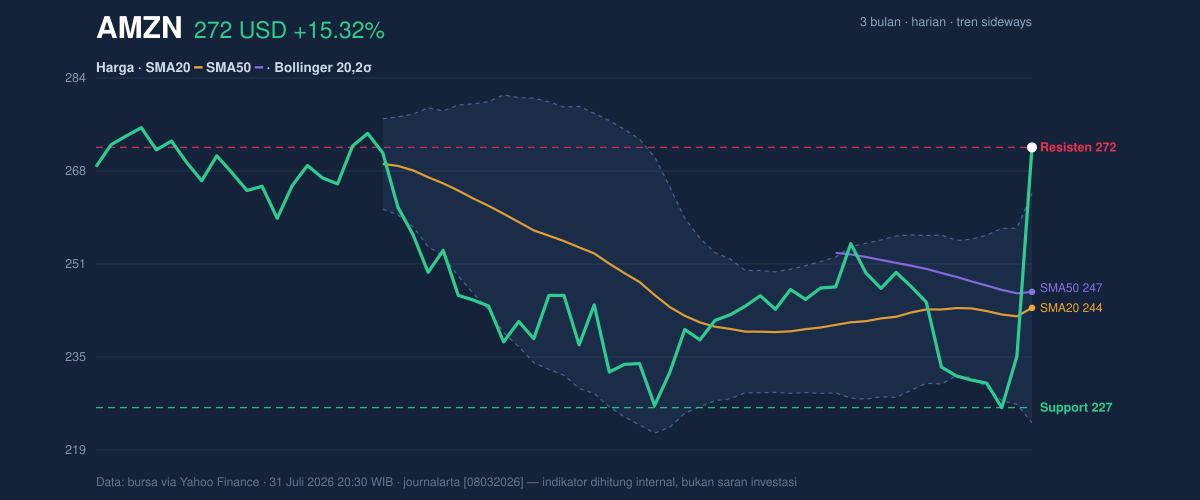
The Bollinger setup helps explain that stretch. Price is not just above the middle band at 243.86; it is also above the upper band at 263.69. That is a sign of a breakout-like push, but it can also mean the stock has moved into an overextended zone where follow-through becomes harder to sustain without a pause. The Bollinger width of 16.3% is described as normal, so this is not a volatility explosion. Instead, Amazon is moving forcefully inside a still-ordinary volatility envelope, which often means the next move will depend more on whether buyers keep showing up than on any broad market shock.
Oscillators & Momentum
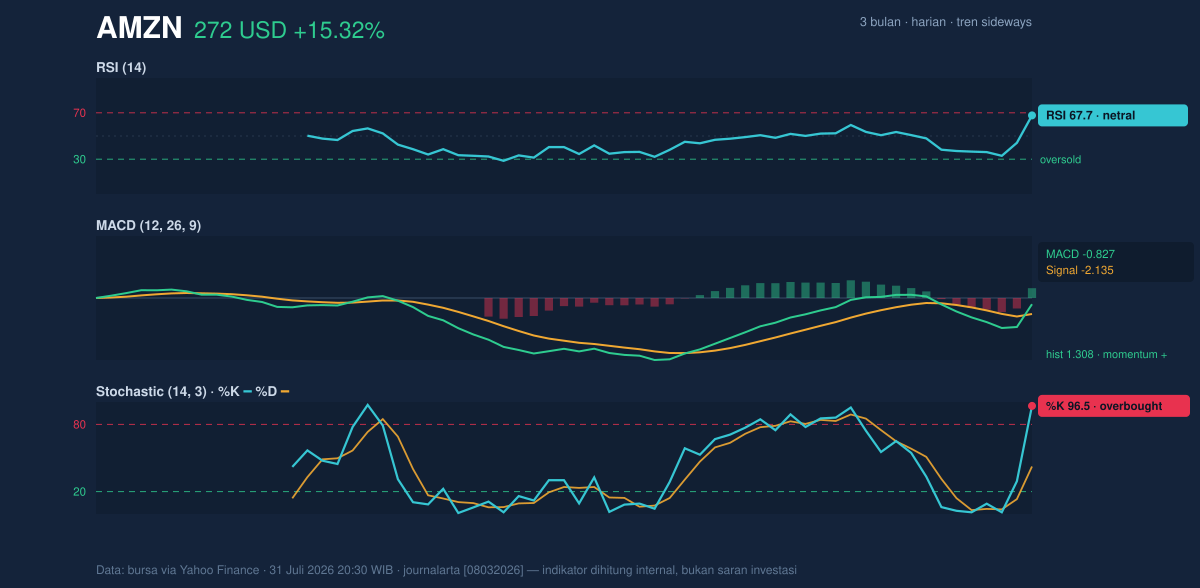
Momentum indicators are mostly constructive, but not cleanly aligned. The MACD at -0.827 remains below zero, yet it sits above the signal line at -2.135, leaving a positive histogram of 1.308. That combination usually means momentum is improving even if the indicator has not fully crossed into bullish territory on the zero line. In simple terms, the engine is revving harder, but the dashboard has not switched fully to green.
The RSI at 67.7 is labeled neutral, though it is close to the conventional overbought threshold. That suggests the stock is strong, but not necessarily washed out enough to automatically reverse. The more aggressive warning comes from the Stochastic %K at 96.5 versus %D at 42.4, which is clearly overbought. Stochastic is especially sensitive to short bursts, so this reading says Amazon has likely advanced faster than its recent average pace. When that happens alongside a strong price jump, the chart often enters a “hot but fragile” phase: upside can continue, but pullbacks become more likely and can be sharp.
The key point is that momentum is supportive, but it is also extended. That is why the current advance looks more like a stretched breakout than a fully mature trend.
Volatility & Volume
The ATR(14) of 9.26, equal to 3.4% of price, points to moderate volatility. This matters because the stock is not moving in a disorderly fashion; it is moving enough to matter, but not enough to suggest panic or a structural break in market function. A move of this size can still produce meaningful daily swings, though, especially when price is already sitting near resistance.
Volume adds another layer. Last trade volume was 128,881,300, compared with a 20-day average of 45,542,845, a 2.8× surge. That is strong participation and usually confirms that the move is not just a thin, mechanical drift. However, the fact that OBV is down complicates the picture. OBV, or on-balance volume, tracks whether volume is accumulating on up days or down days; a decline suggests that the longer-running flow of money has not yet fully turned in the stock’s favor. So while the day’s volume supports the breakout attempt, the broader volume trend is still asking for proof.
Key Levels & Scenarios
The immediate technical map is straightforward. 271.58 is now the first line to watch because it is both the latest price and the current resistance marker. Above that, the next visible reference is the 3-month high at 278.56. On the downside, the first important layer is the SMA20 at 243.86, then the SMA50 at 246.63, with deeper support at 226.65.
If Amazon can hold above the moving averages and keep closing near the upper band, the chart would be signaling that the breakout is gaining acceptance rather than merely spiking. If it slips back below the SMA20, the message changes quickly: the move begins to look like a momentum burst that ran ahead of trend confirmation. A fall toward 226.65 would be a much more serious warning, because that is where the latest range support sits.
Technical Verdict: HOLD (wait & see)
HOLD (wait & see)
- MACD histogram at 1.308 and the MACD line above its signal line show improving momentum.
- Price above SMA20 and SMA50 supports the short-term advance, but no new MA-cross means the trend is not fully confirmed.
- Stochastic at 96.5 and price above the upper Bollinger band at 263.69 suggest the stock is stretched and may need consolidation.
Verdict invalidated if price breaks below 243.86.
- Ideal Entry Range: 243.86 to 246.63
- Exit Target: 271.58 to 278.56
- Stop Loss protection: 226.65
In plain English: Amazon looks strong, but it is already extended, so the chart is asking for confirmation rather than chasing. The next scheduled technical test is whether price can stay above 271.58 and challenge 278.56.
Summary Data AMZN
| Last price | 271.58 USD |
| Change 1 day / 5 days / 1 month | 15.32% / 17.00% / 11.91% |
| Trend / MA-cross | sideways / none |
| SMA20 / SMA50 | 243.86 / 246.63 |
| RSI (14) / Stochastic %K | 67.7 / 96.5 |
| Bollinger %B / ATR | 120% / 9.26 |
| Support / Resistance 20 days | 226.65 / 271.58 |
| Data as of | 31 Juli 2026 20:30 WIB |

