PG Stock Analysis: Gains 0.37%, Testing Support Level
On Agustus 3, 2026: price 144.49 USD, trend sideways, RSI 42.4, support 143.96, resistance 152.75. technical analysis of pg stock. PG Stock Analysis — full…

Procter & Gamble slipped to 144.49 on the NYSE, up 0.37% on the day but still down 1.98% over five days and 4.57% over one month, according to Yahoo Finance data as of 31 July 2026 20:30 WIB. That combination matters more than the one-day bounce: it says the stock is trying to stabilize, but it is doing so from below short-term trend lines and with momentum still leaning negative. For a consumer staples name usually prized for steadiness, the chart is signaling caution rather than urgency.
Trend & Price Action
As shown in the chart, PG is trading below SMA20 at 148.06 and below SMA50 at 147.33, with the SMA20 slope at -0.37% over 5 days. That is a classic short-term weakening pattern: the stock is not in a strong downtrend collapse, but it is losing altitude beneath both near-term and medium-term averages. The absence of a fresh MA-cross means there is no new trend reversal signal yet; instead, the market is stuck in a sideways-to-soft phase where rallies are meeting overhead supply before they can establish a clean breakout.
The broader range also frames the move. PG sits between the 3-month low of 138.86 and high of 154.32, but it is closer to the lower end of that band than the upper end. That positioning suggests the stock has already given back a meaningful chunk of its recent range, yet it has not broken into a new bearish leg. The practical message: the market is waiting for confirmation, not conviction.
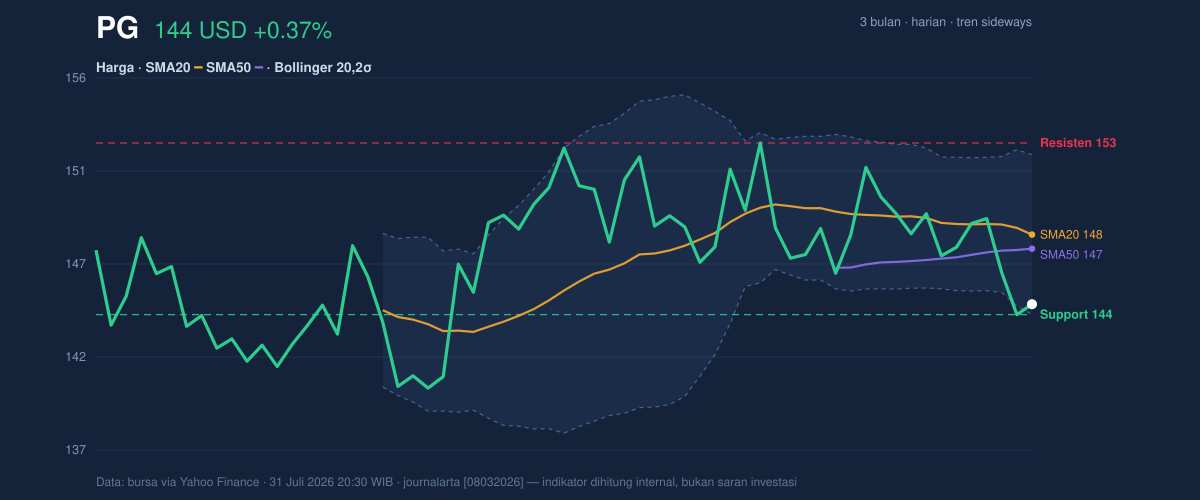
The nearest reference level is the 143.96 support, which is also the prior close. That makes the current area important because a hold there would suggest buyers are still active near the bottom of the recent range. A failure there would expose the stock to a test of the lower part of the 3-month band.
Oscillators & Momentum
The momentum picture is mixed, but the balance still tilts negative. RSI at 42.4 is neutral, which means the stock is neither oversold enough to scream rebound nor strong enough to confirm renewed upside. The Stochastic %K at 30.4 and %D at 32.9 is also neutral, but it is sitting near the lower end of the range, which often tells traders that short-term selling pressure has eased without yet producing a decisive turn higher.
The more important signal is MACD. With MACD at -0.609, the signal line at -0.057, and the histogram at -0.552, momentum remains negative. In plain English, the faster price trend is still running below the slower trend, and the widening gap implied by the histogram says that downside pressure has not fully faded. That does not guarantee further losses, but it does mean any bounce is still being treated as a rally within a weak structure until MACD starts improving.
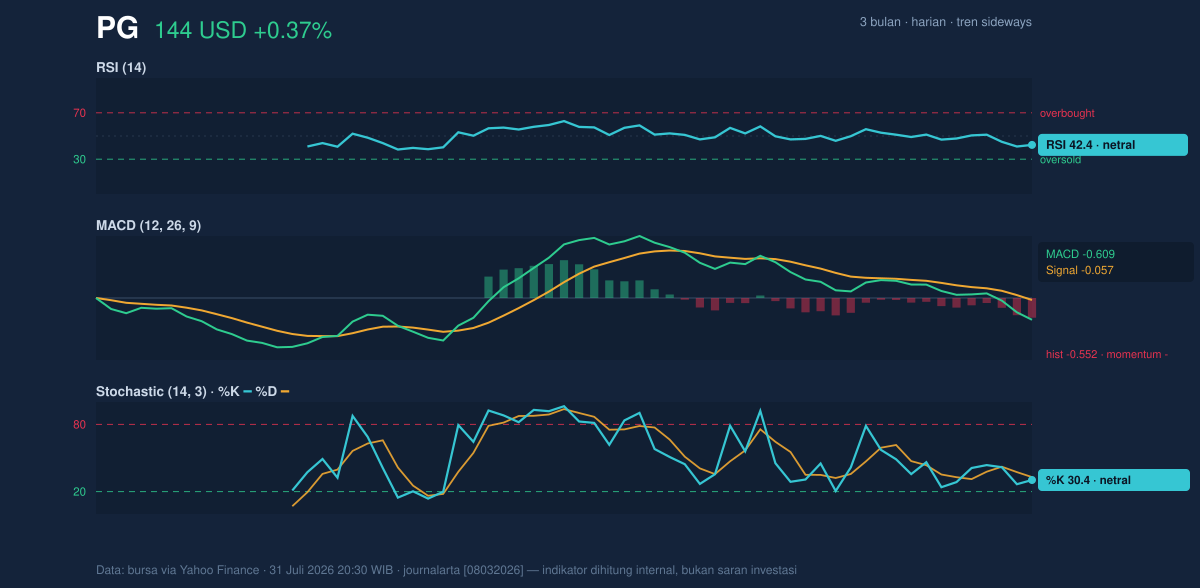
For readers unfamiliar with these indicators: RSI and Stochastic help show whether a stock is stretched too far in one direction, while MACD helps show whether the trend itself is strengthening or weakening. Here, neither oscillator is extreme, but MACD is still doing the heavy lifting — and it is pointing down.
Volatility & Volume
Bollinger Bands add an important layer. PG is trading near the lower band setup, with the lower band at 143.96, the middle band at 148.06, and the upper band at 152.16. The %B at 6% shows price is hugging the lower edge of the range, which often reflects either persistent selling pressure or a stock that is trying to base after a decline. The key detail is that the Bollinger width is 5.5% and is narrowing, a squeeze that can precede a sharper move once the market chooses direction. Squeezes do not predict up or down — they signal that volatility has compressed and a break is getting closer.
Volume supports the idea that the market is engaged. Last volume was 9,145,400 versus a 20-day average of 8,636,785, or 1.1× normal. That is not a dramatic surge, but it is enough to say the latest move had real participation. The caution flag is OBV down, which means cumulative volume flow is not confirming a bullish recovery. In simple terms, more shares have been traded on downswings than on upswings, so the tape is still skeptical.
Volatility is moderate, with ATR at 3.70, or 2.6% of price. That means PG is not behaving like a high-volatility growth name; moves are measured, but with the Bollinger squeeze in place, the next meaningful move could still be larger than the recent day-to-day drift.
Key Levels & Scenarios
The chart’s structure is straightforward: 143.96 is the immediate floor, while 152.75 is the nearest resistance. Between those levels, PG is trading in the lower portion of its recent range, about 6% from support to resistance. That leaves limited room before overhead supply becomes relevant.
If price holds 143.96 and reclaims the 148.06 SMA20, the chart would start to look more constructive because the stock would be moving back toward the center of the Bollinger structure. If instead price falls below 143.96, the next signal would be that the lower band is giving way, and the market could begin probing the lower end of the 3-month range near 138.86. On the upside, a move through 152.75 would matter because it would clear the immediate ceiling and challenge the recent range high at 154.32.
Technical Verdict: HOLD (wait & see)
HOLD (wait & see)
- MACD remains negative, which says downside momentum is still in place.
- Price is below SMA20 and SMA50, so the short-term trend has not yet repaired itself.
- Bollinger Bands are squeezing, which raises the odds of a directional move but does not yet show the direction.
Verdict invalidated if price falls below 143.96, because that would break immediate support and weaken the current base.
- Ideal entry range: 143.96 to 148.06
- Exit target: 152.75
- Stop loss protection: below 143.96
In plain English: PG is not showing a clean recovery signal yet, but it is close enough to support that the next move could matter.
Summary Data PG
| Last price | 144.49 USD |
| Change 1 day / 5 days / 1 month | 0.37% / -1.98% / -4.57% |
| Trend / MA-cross | sideways / none |
| SMA20 / SMA50 | 148.06 / 147.33 |
| RSI (14) / Stochastic %K | 42.4 / 30.4 |
| Bollinger %B / ATR | 6% / 3.70 |
| Support / Resistance 20 days | 143.96 / 152.75 |
| Data as of | 31 Juli 2026 20:30 WIB |


