CRM Stock Analysis: Gains 2.71%, Golden Cross Formed
On Agustus 5, 2026: price 190.99 USD, trend uptrend, RSI 63.7, support 156.93, resistance 190.99. technical analysis of crm stock. CRM Stock Analysis — full…

Salesforce (CRM) rose to 190.99 USD on the NYSE as traders pushed the stock to the top of its recent range, according to Yahoo Finance data at 4 August 2026 20:30 WIB. The move matters because it came with the shares sitting above both short- and medium-term trend lines, yet also pressing into a zone where momentum looks stretched.
The stock climbed 2.71% in a day, 5.23% over five days and 12.67% over one month. That sequence says the advance is not a one-day spike; it is a sustained bid that has been building for weeks. At the same time, the latest price is now almost touching the upper Bollinger band at 191.44, which often signals that a rally is strong but also that it may be running close to the edge of its near-term envelope.
Trend & Price Action
The chart shows CRM in a clear uptrend, with the 20-day moving average rising at a 3.25% pace over the past five days. That slope is important: it means the average price itself is moving higher, not just the latest quote. Salesforce is also trading above its SMA20 at 172.71 and SMA50 at 171.44, while the golden cross — the 20-day average moving above the 50-day average — confirms that shorter-term price action has overtaken the longer trend. In plain language, this is the kind of setup that usually reflects improving market confidence rather than a temporary bounce.
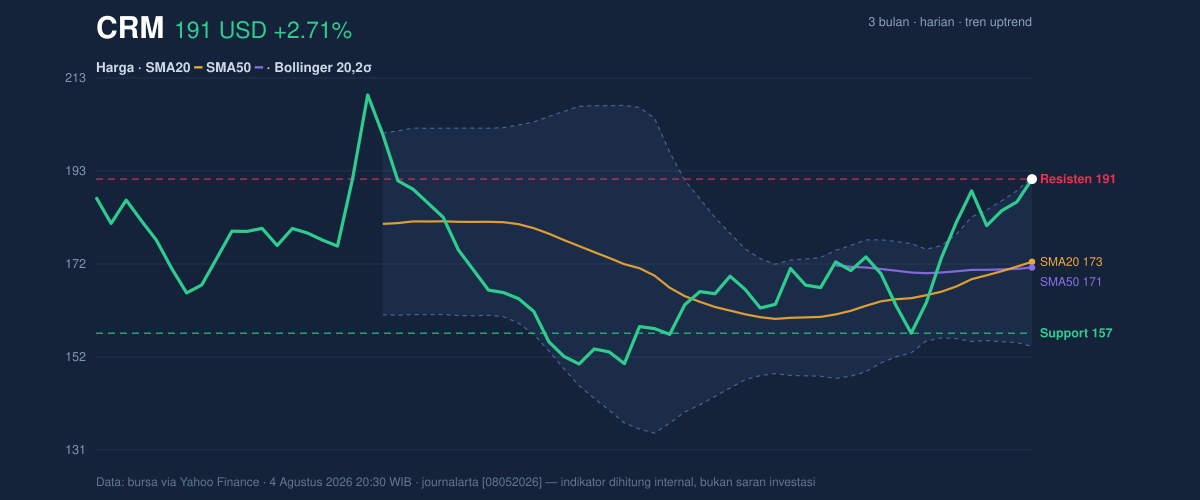
The stock is also at 100% of its 20-day range, with the 20-day support marked at 156.93 and the latest price sitting at the top of that band. That position is powerful, but it leaves little room for error. Salesforce is also between its 3-month low of 146.32 and 3-month high of 211.34, meaning the share price has recovered a large part of its prior drawdown but has not yet retested the upper end of the wider range.
Oscillators & Momentum
Momentum is still positive, but it is not uniformly fresh. The RSI at 63.7 is best described as neutral, which means the stock is not yet in a classic overbought danger zone on that measure. However, the Stochastic %K at 93.0 and %D at 85.1 are clearly overbought, a sign that the stock has moved up faster than recent trading ranges would normally justify. That does not automatically mean a reversal is imminent; it does mean the rally is extended and more vulnerable to pauses or pullbacks.
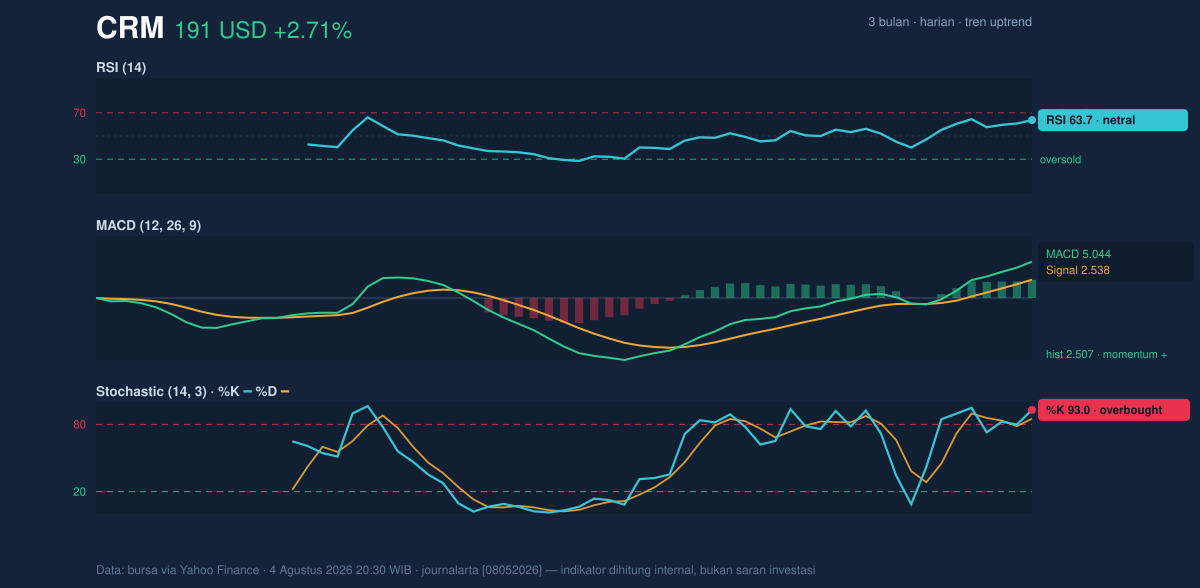
The MACD at 5.044 remains above its signal line at 2.538, with a positive histogram of 2.507. That combination says trend momentum is still intact and the latest price gains are being supported by underlying acceleration. Put simply, the MACD is still confirming the move higher even as the stochastic warns that the stock may be getting crowded at the top of its recent range.
Volatility & Volume
Volatility is elevated. The Bollinger bands are wide, with a 21.7% band width, and the ATR(14) at 9.00 equals about 4.7% of the share price. ATR measures the average daily trading range, so this reading implies that CRM can move a meaningful distance in either direction in a single session. In a strong trend, that often helps continuation; near resistance, it also raises the risk of a sharp snapback if buyers hesitate.
The latest volume of 9,319,600 was below the 20-day average of 12,698,135, or about 0.7× normal. That matters because the stock is advancing without full participation from the broader market. Price is rising, and OBV is climbing, which indicates cumulative buying pressure is still improving, but the lighter tape suggests the breakout has not yet been confirmed by a surge in turnover. In other words, demand is present, but not emphatic.
Key Levels & Scenarios
The nearest technical ceiling is the 190.99 area itself, with the Bollinger upper band at 191.44 acting as a closely watched overhead marker. A decisive move above that band would suggest the stock is not just extended, but capable of sustaining trade outside its recent statistical range. On the downside, the key reference is the 20-day support at 156.93, which also anchors the lower part of the recent trading structure.
If CRM holds above the 172.71 middle Bollinger line and its SMA20, the trend remains constructive. If it fails to stay above that zone, the market would likely interpret the move as a loss of short-term momentum rather than a full trend break. The current setup is therefore strong, but not low-risk: the stock is near resistance, momentum is stretched, and volume is not yet confirming with force.
Technical Verdict: HOLD (wait & see)
HOLD (wait & see)
- RSI 63.7 keeps the trend constructive, while MACD 5.044 above signal 2.538 shows the uptrend is still intact.
- Stochastic 93.0/85.1 is overbought, and price is pressing the upper Bollinger band at 191.44, which raises the chance of near-term consolidation.
- Volume is only 0.7× normal, so the latest push lacks strong participation even though OBV is rising.
Verdict invalidated if price breaks below 156.93.
- Ideal entry range: 172.71 to 176.93
- Exit target: 190.99 to 191.44
- Stop loss protection: 156.93
For non-traders, this means the stock still looks healthy, but it is close enough to resistance that patience matters more than chasing the move.
Salesforce’s latest 20-day support level is 156.93.
Summary Data CRM
| Last price | 190.99 USD |
| Change 1 day / 5 days / 1 month | 2.71% / 5.23% / 12.67% |
| Trend / MA-cross | uptrend / golden |
| SMA20 / SMA50 | 172.71 / 171.44 |
| RSI (14) / Stochastic %K | 63.7 / 93.0 |
| Bollinger %B / ATR | 99% / 9.00 |
| Support / Resistance 20 days | 156.93 / 190.99 |
| Data as of | 4 Agustus 2026 20:30 WIB |



