HD Stock Technicals Today: Gains 2.42%, Testing Key Resistance
On Agustus 5, 2026: price 348.24 USD, trend sideways, RSI 58.1, support 324.71, resistance 348.24. technical analysis of hd stock. HD Stock Technicals — full…

Home Depot shares on the NYSE rose to 348.24, up 2.42% from the previous close of 340.02, as the stock pushed to the very top of its recent trading band, according to Yahoo Finance data cited in the 4 August 2026 20:30 WIB update. The move matters because it is not just a one-day pop: price is now sitting above both the SMA20 at 337.38 and the SMA50 at 332.24, which tells traders the stock is still trading above its short- and medium-term average cost basis. That usually signals underlying resilience, but the broader picture is less clean than the headline gain suggests. The trend is still described as sideways, and the 20-day moving average is slipping at -0.96% over 5 days, a sign that buyers have not yet fully converted the rebound into a sustained uptrend.
Trend & Price Action
The chart shows a stock that has recovered enough to stand above its moving averages, but not enough to break decisively out of its range.
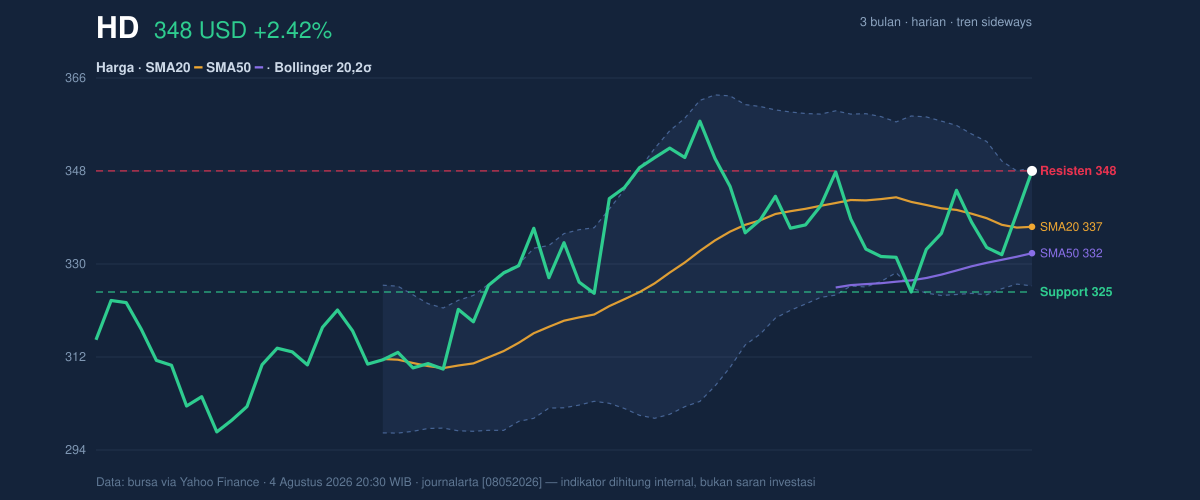
Home Depot’s position relative to its averages is constructive: trading above the SMA20 and SMA50 means recent price strength is being supported by trend-following models, even though the market has not produced a fresh moving-average cross. In plain language, there is no new “golden cross” or “death cross” to force a strong trend signal. That absence matters because it leaves the stock in a holding pattern: the market is leaning upward, but not with enough conviction to declare a new phase.
The most important detail is where price sits inside the Bollinger envelope. With the upper band at 348.88 and price at 348.24, the stock is pressing against the ceiling of its recent volatility range. That is a sign of strength, but also of compression risk: when price reaches the band edge while the band width is only 6.8%, the next move can be sharper than the last one if the squeeze resolves. If the stock cannot extend beyond this area, it may simply rotate back toward the middle band at 337.38.
A strong day, but not a clean breakout.
Oscillators & Momentum
Momentum is supportive, but it is starting to look stretched in the short term.
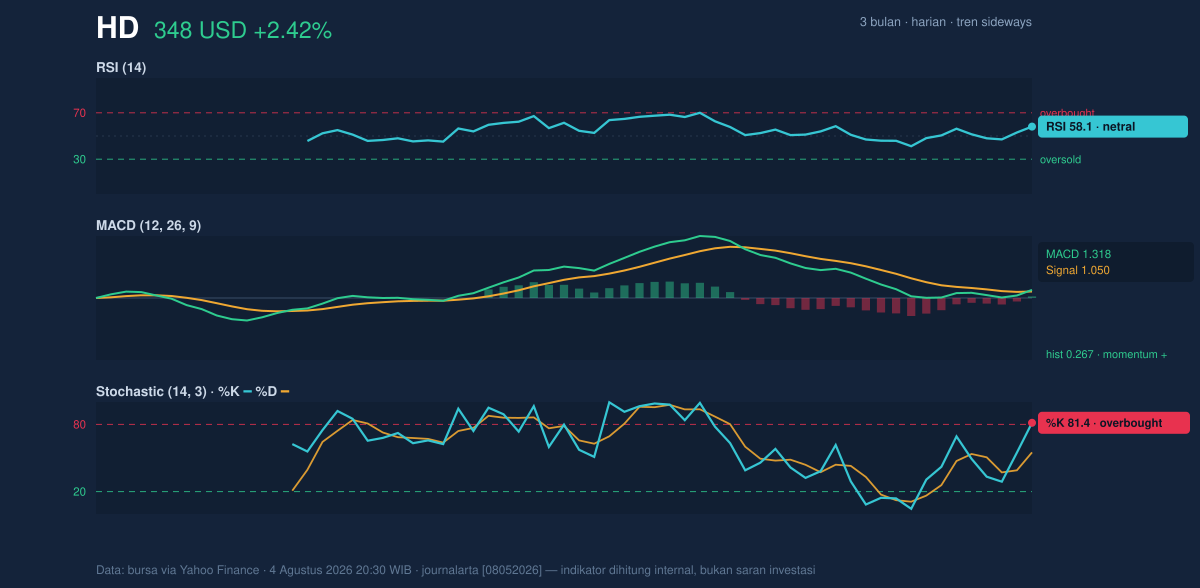
The RSI at 58.1 is neutral, which means the stock is not in a classic overbought or oversold condition. That is important because it suggests the broader move still has room before becoming technically crowded. But the Stochastic %K at 81.4 versus %D at 55.0 is a more aggressive signal: stochastic readings above 80 often imply the stock has moved quickly relative to its recent range and may be vulnerable to a pause or pullback. In other words, the market has been buying Home Depot fast enough to push the short-term oscillator into overbought territory even though the broader momentum gauge has not become extreme.
The MACD at 1.318 above the signal line at 1.050, with a positive histogram of 0.267, is the clearest bullish confirmation in the dataset. MACD measures whether shorter-term momentum is outrunning longer-term momentum; when the line is above the signal and the histogram is positive, it means upside momentum still has the upper hand. Yet the combination of MACD strength and stochastic overbought conditions usually points to a market that can keep rising, but may do so unevenly.
That is the tension in the setup.
Volatility & Volume
Volatility is moderate, but the band structure suggests the stock may be preparing for a larger directional move.
The ATR at 9.45, or 2.7% of price, indicates a normal-to-moderate daily range for a large-cap retailer. ATR, or average true range, is a gauge of how much a stock typically moves in a day; here, it says the name is active enough to matter, but not chaotic. The tighter 6.8% Bollinger width reinforces that idea: volatility has compressed, and compressed volatility often precedes expansion. The market is coiling, not exploding.
Volume adds a layer of caution. Last volume was 4,273,900, about 1.1× the 20-day average of 3,864,880, so the latest advance did attract somewhat more participation than normal. But OBV is down, and that is the softer note in the tape. OBV, or on-balance volume, is designed to show whether volume is broadly supporting price. A falling OBV while price is near the top of the range can mean the rally is not yet being confirmed by longer-term accumulation. In practical terms, the stock is rising, but the volume trail has not fully endorsed the move.
Key Levels & Scenarios
The chart’s most immediate reference points are clear: support at 324.71 and resistance at 348.24, with the 3-month high at 358.85 and the 3-month low at 289.10. Because price is already at 100% of its recent range, the market is effectively testing the upper boundary right now.
If Home Depot can hold above the 348.24 area and push through the 348.88 Bollinger upper band, that would signal the squeeze is resolving upward, and the next reference becomes the 358.85 3-month high. If it fails to hold this zone, the first place traders will look is the middle band at 337.38, then the stronger support area at 324.71. A drop back under the lower part of the recent band would suggest the current rally was more of an overextended range move than the start of a durable breakout.
Technical Verdict: HOLD (wait & see)
The setup is constructive, but not yet decisive enough to call a clean trend breakout.
- MACD is positive, showing momentum still favors the upside.
- Price is above SMA20 and SMA50, which confirms the stock is trading with near-term strength.
- Stochastic is overbought and OBV is down, which tempers confidence in the move.
Verdict invalidated if price breaks below 324.71.
- Ideal Entry Range: 337.38 to 348.24
- Exit Target: 358.85
- Stop Loss protection: 324.71
In plain English: Home Depot is leaning upward, but the market is still asking for proof that this strength can last.
Summary Data HD
| Last price | 348.24 USD |
| Change 1 day / 5 days / 1 month | 2.42% / 1.09% / 0.88% |
| Trend / MA-cross | sideways / none |
| SMA20 / SMA50 | 337.38 / 332.24 |
| RSI (14) / Stochastic %K | 58.1 / 81.4 |
| Bollinger %B / ATR | 97% / 9.45 |
| Support / Resistance 20 days | 324.71 / 348.24 |
| Data as of | 4 Agustus 2026 20:30 WIB |



