Momentum Weakens, PG Stock Gains 2.10% Today
On Agustus 5, 2026: price 148.01 USD, trend sideways, RSI 51.2, support 143.96, resistance 151.50. technical analysis of pg stock. Momentum Weakens — full…

Procter & Gamble’s shares rose to 148.01 USD, up 2.10% on the day, but the move sits inside a broader sideways pattern rather than a clean trend change. The stock is trading just above its short-term averages, with SMA20 at 147.60 and SMA50 at 147.48, while the monthly change remains -3.10%. That matters because it suggests the latest bounce is more a test of stability than a decisive rerating: buyers have been willing to defend the area around the moving averages, yet they have not forced a lasting break above the nearby ceiling.
Trend & Price Action
As shown in the chart, PG is positioned in the middle of its recent range, with price sitting at about 54% of the 20-day range and the stock still below the 3-month high of 154.32 but above the 3-month low of 138.86. The key message from that placement is balance: the market is neither pricing in a strong downside break nor a convincing upside trend. The fact that the SMA20 is sloping down by 0.67% over 5 days tells us the short-term trend is still leaning soft, even though price is now slightly above both the 20-day and 50-day averages.
That combination often signals a market that is trying to stabilize after weakness, but has not yet proven it can sustain momentum. The lack of a new MA-cross reinforces that point: there is no fresh moving-average signal to confirm a regime shift. The chart is showing compression, not conviction.
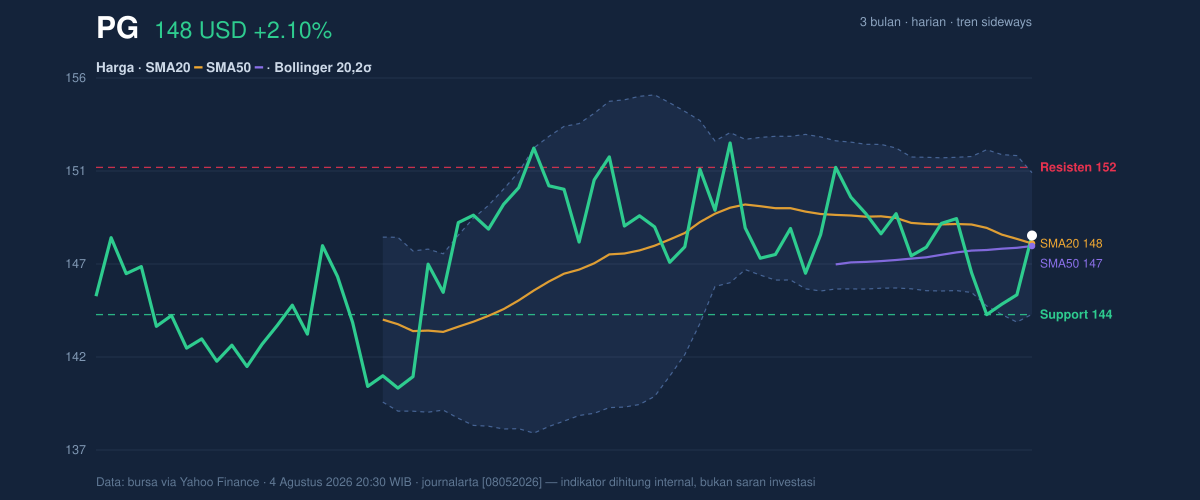
The important part is not just that PG is above the averages; it is that the averages themselves are clustered tightly together. That usually means the market is waiting for a catalyst.
Oscillators & Momentum
The momentum picture is more cautious than the price action. RSI at 51.2 is neutral, which means the stock is not stretched in either direction and has room to move without immediately running into an overbought or oversold condition. Stochastic %K at 55.3 and %D at 39.8 also sit in neutral territory, but the spread between the two lines suggests short-term improvement is still developing rather than fully established.
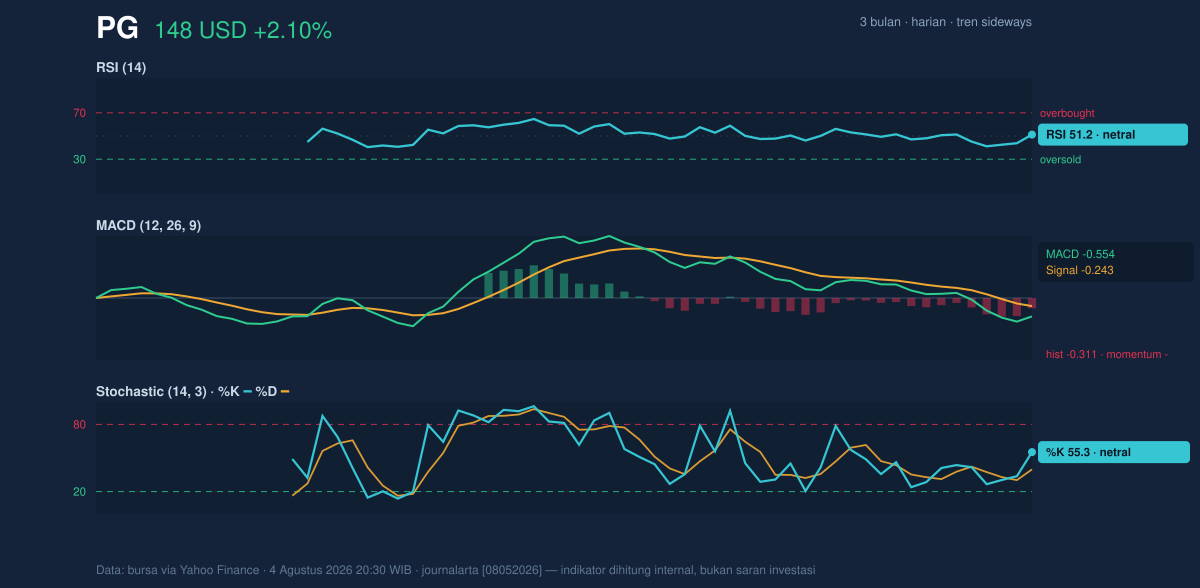
The problem is the MACD at -0.554, with the signal line at -0.243 and the histogram at -0.311. In plain terms, MACD is a trend-following gauge, and a negative reading means downside momentum still outweighs upside force even if the stock has bounced. The histogram being below zero confirms that the rebound has not yet translated into stronger trend energy. So while RSI and Stochastic are neutral, MACD is still warning that the recent lift may be a pause rather than a reversal.
That divergence matters. When price is stabilizing but MACD remains negative, the market is often in a transition phase: sellers are losing pressure, but buyers have not yet taken control.
Volatility & Volume
Volatility is contained but not asleep. ATR at 3.72, or 2.5% of price, points to moderate daily movement, while the Bollinger Band width of 4.9% shows the bands are tightening in a squeeze. A squeeze often precedes a sharper move because the market has been coiling into a narrower range. The key point is that compression does not predict direction; it only says the next meaningful break could travel faster once it starts.
The Bollinger position also helps frame the current tone. With %B at 56%, PG is slightly above the middle band at 147.60 and not near the upper band at 151.23. That is consistent with a market recovering, but not yet pressing the upper boundary. Volume gives a similar message: the latest trade count of 7,359,900 was below the 20-day average of 8,628,095, or about 0.9x normal. In other words, the bounce happened without full participation. Yet OBV is rising, which suggests that, over time, accumulation has been improving even if the latest session did not come with heavy turnover.
The result is a mixed but constructive setup: price is firming, volume is not confirming aggressively, and the bands are tightening.
Key Levels & Scenarios
The market is now focused on a clearly defined corridor. On the downside, 143.96 is the nearest support from the 20-day range and sits just below the lower Bollinger band at 143.97, making it a practical line where short-term buyers would need to show up again. On the upside, 151.50 is the immediate resistance, with the Bollinger upper band at 151.23 sitting very close by. That proximity matters because it means any attempt to clear resistance would also have to push through the edge of the recent volatility envelope.
If PG holds above 143.96, the chart suggests the stock can continue building inside the current range and potentially test 151.23-151.50. If it fails there, the move would likely be interpreted as another range-bound rejection rather than a trend breakout. If 143.96 gives way, the price would be slipping back toward the lower part of the three-month range and the recent stabilization would lose credibility.
Technical Verdict: HOLD (wait & see)
The setup is neutral-to-cautious rather than decisively bullish or bearish.
- RSI at 51.2 and Stochastic at 55.3/39.8 show neutral momentum, so the stock is not overextended.
- MACD remains negative, which means the rebound has not yet been backed by stronger trend momentum.
- Bollinger Bands are squeezing, so a larger move may be coming, but direction is still unconfirmed.
Verdict invalidated if price falls below 143.96, because that would break the nearest support and weaken the current base.
- Ideal Entry Range: 143.96 to 147.60
- Exit Target: 151.23 to 151.50
- Stop Loss: below 143.96
For non-traders, this means PG is holding steady, but the chart still needs a stronger signal before the next move can be trusted.
Summary Data PG
| Last price | 148.01 USD |
| Change 1 day / 5 days / 1 month | 2.10% / -0.58% / -3.10% |
| Trend / MA-cross | sideways / none |
| SMA20 / SMA50 | 147.60 / 147.48 |
| RSI (14) / Stochastic %K | 51.2 / 55.3 |
| Bollinger %B / ATR | 56% / 3.72 |
| Support / Resistance 20 days | 143.96 / 151.50 |
| Data as of | 4 Agustus 2026 20:30 WIB |


