QCOM Stock Technicals Today: Gains 7.32%, Momentum Weakens
On Agustus 5, 2026: price 162.67 USD, trend downtrend, RSI 42.5, support 147.61, resistance 191.11. technical analysis of qcom stock. QCOM Stock Technicals —…

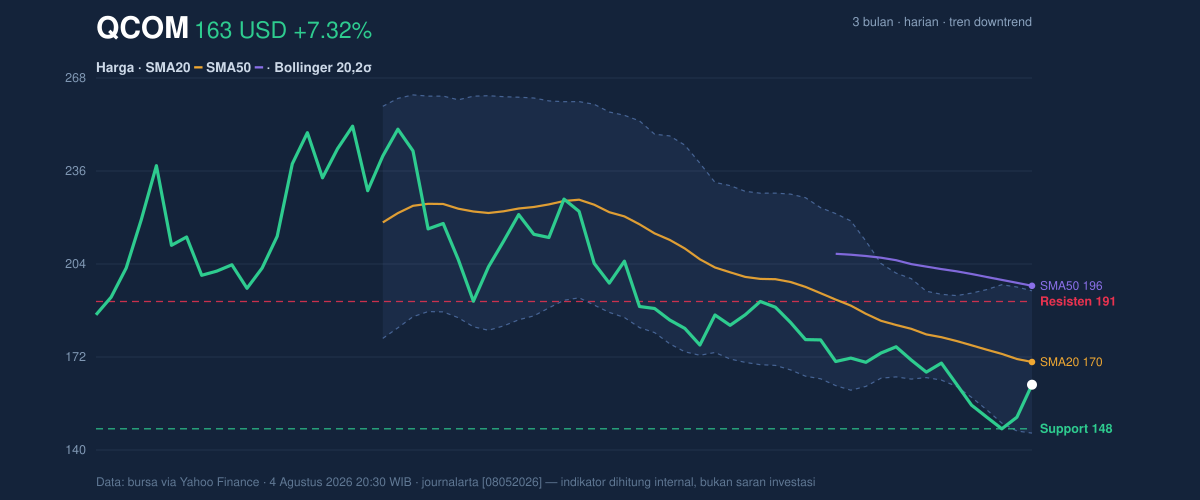
Qualcomm (QCOM) on NASDAQ jumped to 162.67 USD after a 7.32% one-day rise, but the move still leaves the stock in a broader downtrend as shown by the chart and the SMA20 at 170.44 sitting above price, with the SMA50 at 196.48 even further overhead. That matters because a rally under both moving averages usually reads less like a trend reversal and more like a recovery inside a weak tape. The stock has also fallen 11.09% over the past month, so the latest bounce needs to be judged against a still-heavy medium-term structure, not just the day’s gain.
The price is now trading in the lower half of its recent range, at about 35% of the 20-hour range, between 147.61 support and 191.11 resistance. In plain terms, buyers have defended the floor, but they have not yet reclaimed enough ground to say the selloff has been fully repaired. The fact that the stock remains below the 20-day Bollinger middle band at 170.44 reinforces that point: the middle band often acts like a short-term trend line, and staying under it suggests the recovery is still fragile.
Trend & Price Action
As shown in the chart, Qualcomm’s price structure is still defined by a falling short-term average, with the SMA20 down 4.03% over 5 days. That slope is important because it shows the trend is not merely below average; the average itself is pointing lower, which usually means recent selling has been persistent enough to drag the benchmark down. There is also no new MA-cross, so there is no fresh moving-average signal confirming a turn. The gap between 162.67 and the SMA50 at 196.48 is wide enough to show the stock remains well below its intermediate trend line, a sign that the market has not yet rebuilt confidence beyond a tactical bounce.
The 3-month low at 142.89 is close enough to matter.
That keeps the downside floor in view.
Oscillators & Momentum
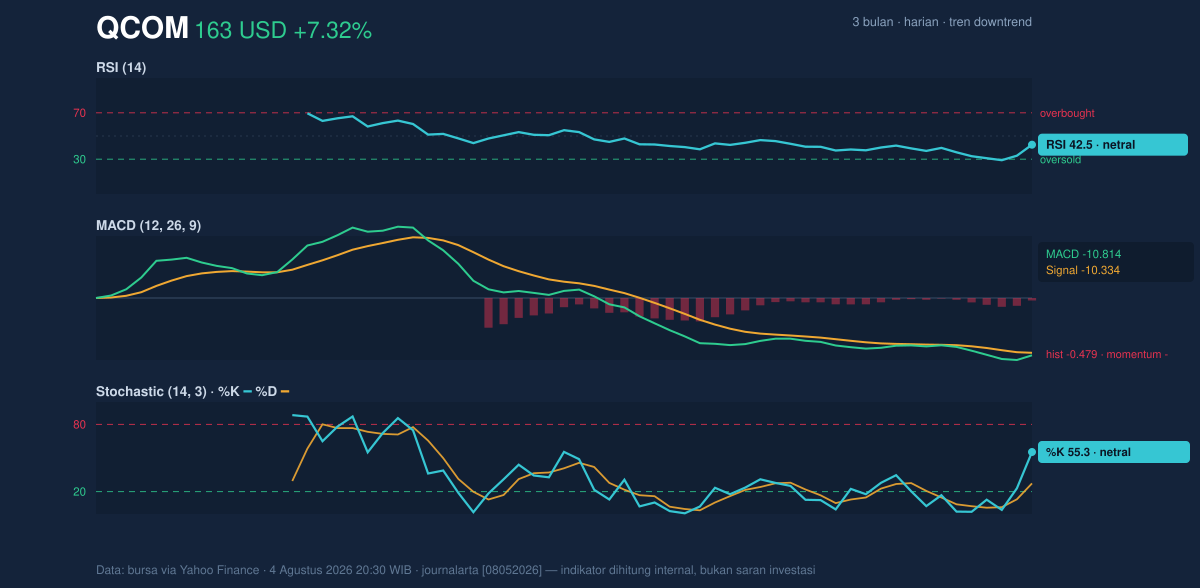
The momentum picture is mixed, but not strongly constructive. The RSI at 42.5 is neutral, which means the stock is neither oversold nor overbought; in other words, the recent bounce has not yet reached the kind of stretched condition that often precedes a pullback, but it also has not generated enough strength to signal a convincing trend shift. The Stochastic %K at 55.3 and %D at 27.3 are also neutral, but the spread between them suggests short-term momentum has improved faster than the slower signal line. That can happen early in a rebound, yet it is not the same as a confirmed reversal.
The more cautionary signal is the MACD at -10.814, still below its signal line at -10.334, with a histogram of -0.479. For readers less familiar with the term, MACD is a trend-following indicator; when it stays negative and below the signal line, it usually means downside momentum is still in control even if price is bouncing. So while the oscillator set is no longer deeply weak, it has not flipped decisively positive.
Volatility & Volume
Volatility is elevated. The ATR(14) at 7.88, equal to 4.8% of price, suggests daily swings remain wide enough to matter, and the Bollinger Bands are 28.5% wide, described here as expanding. Expanding bands usually mean the market is not settling down; instead, it is pricing in larger moves after a period of stress. The %B at 34% shows the stock is sitting in the lower part of the band structure, closer to the lower band at 146.13 than the upper band at 194.75. That positioning is consistent with a stock that has bounced, but has not yet done enough to reclaim the center of gravity.
Volume adds a useful nuance. Trading volume of 16,334,900 was about 1.2x normal versus the 20-hour average of 13,280,105, which means the latest move had more participation than a quiet drift. But OBV is down, and that matters because OBV, or on-balance volume, tracks whether volume is accumulating on up days or being distributed on down days. A falling OBV while price rebounds can imply the bounce is not yet being broadly supported by longer-term buyers.
The tape is active, but not yet healed.
Key Levels & Scenarios
The immediate technical map is clear from the data. Support at 147.61 is the first level that matters on weakness, and the nearby 3-month low at 142.89 is the deeper reference if that floor gives way. On the upside, 170.44 is the first reclaim point because it matches the SMA20 and the Bollinger middle band; above that, 191.11 is the next resistance zone, with the SMA50 at 196.48 sitting just above it as a heavier overhead barrier. If price can regain 170.44 and hold there, that would improve the quality of the rebound. If it fails to hold 147.61, the market would be signaling that the recent bounce was only temporary.
Technical Verdict: HOLD (wait & see)
HOLD (wait & see)
- Reason 1: Price remains below the SMA20 at 170.44 and far under the SMA50 at 196.48, so the broader trend is still weak.
- Reason 2: MACD is negative and below its signal line, which says downside momentum has not fully cleared.
- Reason 3: RSI 42.5 and Stochastic 55.3 / 27.3 are neutral, meaning the bounce has room, but no strong confirmation yet.
- Verdict invalidated if price breaks below 147.61, which would expose the 142.89 low.
- Ideal Entry Range: 147.61–170.44
- Exit Target (Target Price): 191.11–196.48
- Stop Loss protection: below 147.61
In plain English: the stock has bounced, but it has not yet proved the downtrend is over.
Qualcomm’s 20-hour support is 147.61.
Summary Data QCOM
| Last price | 162.67 USD |
| Change 1 day / 5 days / 1 month | 7.32% / -0.13% / -11.09% |
| Trend / MA-cross | downtrend / none |
| SMA20 / SMA50 | 170.44 / 196.48 |
| RSI (14) / Stochastic %K | 42.5 / 55.3 |
| Bollinger %B / ATR | 34% / 7.88 |
| Support / Resistance 20 days | 147.61 / 191.11 |
| Data as of | 4 Agustus 2026 20:30 WIB |



