Testing Key Resistance, ORCL Stock Gains 2.74% Today
On Agustus 5, 2026: price 145.74 USD, trend sideways, RSI 55.8, support 114.99, resistance 145.74. technical analysis of orcl stock. Testing Key Resistance —…

Oracle is trading near the top of its recent range, but the signal mix is more about stretched momentum than a clean trend reversal, leaving international investors watching whether the latest surge can hold.
Oracle shares closed at 145.74 USD, up 2.74% on the day, according to Yahoo Finance data cited in the market feed at 4 August 2026 20:30 WIB. That follows a much sharper 21.49% gain over the past five days, even though the stock is only up 2.92% over one month. The pattern matters: a fast weekly rise with a flatter monthly gain often signals a sudden re-rating rather than a steady climb. In plain terms, the market has rushed to price in something new, but it has not yet built a broad, durable trend.
Trend & Price Action
Oracle remains in a sideways trend, with the SMA20 at 128.99 and the SMA50 at 163.11. The price is above the SMA20 but still below the longer average, which usually means the stock has recovered from weakness but has not fully repaired the broader structure. The SMA20 slope is -1.97% over five days, and that declining short-term average is a reminder that the recent bounce is happening inside a still-fragile setup.
The chart also shows no fresh MA-cross, meaning there has not been a new signal from the short average crossing the long one. That matters because a moving-average crossover is often treated as a trend confirmation tool; without it, the move is better read as a fast rally inside a range rather than a proven shift in direction.
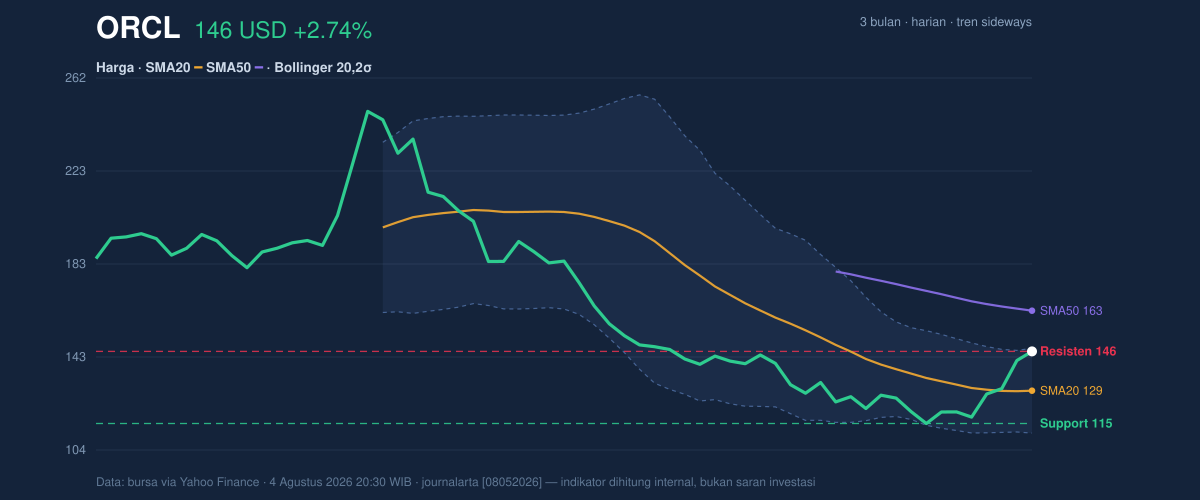
At the current level, Oracle is sitting at the 100% mark of its 20-hour range, with support at 114.99 and resistance at 145.74. It is also trading just under the Bollinger upper band at 147.08, which shows the stock has pushed to the edge of its recent statistical envelope. That does not automatically mean reversal, but it does mean the market is paying a premium relative to the last 20 sessions.
A move this far up the band is rarely quiet.
Oscillators & Momentum
Momentum is mixed, and that mix is the key story. The RSI at 55.8 is neutral, which means Oracle is not yet in a classic overbought zone by that measure. But the Stochastic %K at 91.3 and %D at 88.8 are both in overbought territory, suggesting the stock has risen so quickly that near-term momentum is stretched. For general readers, Stochastic is a fast gauge of where price sits within its recent range; readings this high often mean buyers have been dominant, but the pace may be getting ahead of itself.
The MACD at -6.713 versus a signal line at -11.213 leaves a positive histogram of 4.500, which is a constructive sign. In simple terms, MACD is still below zero, so the broader momentum picture is not fully bullish, but the gap between MACD and its signal line shows the move is improving. That is why the stock can look strong on a short-term chart while still lacking a fully confirmed trend on a longer one.
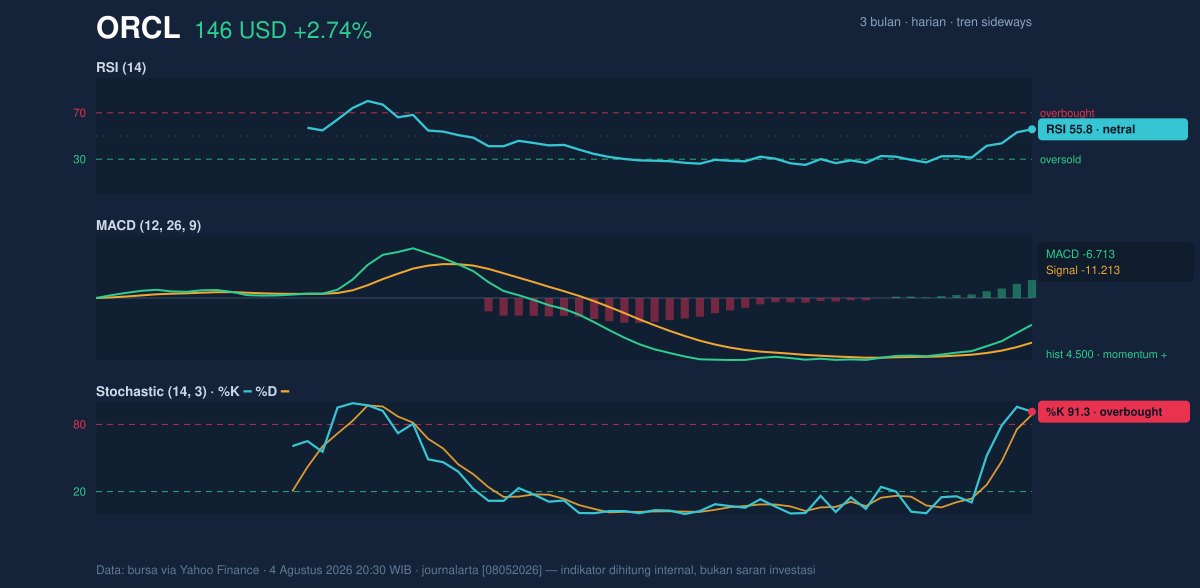
This combination — neutral RSI, overbought Stochastic, and improving MACD — usually points to a rally that is strong but not fully synchronized. Traders often watch for whether the faster indicators cool without breaking price, or whether they roll over first.
Volatility & Volume
The volatility backdrop is elevated. The Bollinger Bands are widening, with a 28.1% band width and %B at 96%. A widening band means the stock is moving more aggressively than before; it often follows a period of compression, but it can also accompany a sharp repricing phase. With price near the upper band, the market is telling us the move has already consumed a lot of the available near-term upside energy.
The ATR at 7.56, or 5.2% of price, reinforces that message. ATR measures the average daily travel range, so a reading like this means Oracle can swing meaningfully even on ordinary sessions. That matters because a stock sitting near resistance with high ATR can either break out quickly or snap back just as fast.
Volume is adding some credibility, but not overwhelming conviction. Last volume was 43,611,900 versus a 20-day average of 39,097,280, or 1.1× normal, and OBV is rising. Rising OBV means trading volume is generally supporting the price advance, which is healthier than a rally built on thin participation. Still, 1.1× is supportive rather than explosive, so the market has participation, but not the kind that usually accompanies a fully decisive breakout.
Key Levels & Scenarios
The immediate line in the sand is the 145.74 resistance area, which is also the current price. Above that, the 147.08 Bollinger upper band is the next technical ceiling shown in the chart. On the downside, the first meaningful support is 128.99, the SMA20 and Bollinger middle band, while the deeper support zone sits at 114.99. The 3-month low is 114.50, which closely aligns with that lower support region and gives it added importance.
If Oracle holds above the 128.99 area, the chart can remain constructive, because that would mean the recent spike has not fully unwound. If it loses that zone, the rally starts to look more like an exhaustion move. If price can clear and stay above 147.08, the market would be signaling that buyers are willing to pay above the recent statistical range, which is often how a range begins to expand upward. If it fails there, the overbought Stochastic reading becomes more relevant as a warning that the rally has run ahead of itself.
Technical Verdict: HOLD (wait & see)
HOLD (wait & see) because the chart is strong on short-term momentum but not yet confirmed by the broader trend.
- MACD histogram is positive, showing improving momentum even though MACD remains below zero.
- Stochastic is overbought, which warns the recent surge may be stretched near resistance.
- Price is above SMA20 but below SMA50, so the stock has recovered, but the wider trend is not fully repaired.
Verdict invalidated if price falls below 128.99, because that would break the short-term trend support and weaken the current rally structure.
- Ideal Entry Range: 128.99 to 145.74
- Exit Target: 147.08
- Stop Loss protection: 114.99
For non-traders: Oracle looks strong right now, but the chart is saying the move still needs proof before it can be trusted.
Summary Data ORCL
| Last price | 145.74 USD |
| Change 1 day / 5 days / 1 month | 2.74% / 21.49% / 2.92% |
| Trend / MA-cross | sideways / none |
| SMA20 / SMA50 | 128.99 / 163.11 |
| RSI (14) / Stochastic %K | 55.8 / 91.3 |
| Bollinger %B / ATR | 96% / 7.56 |
| Support / Resistance 20 days | 114.99 / 145.74 |
| Data as of | 4 Agustus 2026 20:30 WIB |



