CRM Stock Gains 1.04%, Golden Cross Formed In Focus
On Agustus 6, 2026: price 192.98 USD, trend uptrend, RSI 64.9, support 156.93, resistance 192.98. technical analysis of crm stock. CRM Stock Gains — full…

Salesforce (CRM) rose to 192.98 USD on the NYSE, up 1.04% from the previous close of 190.99, as the stock extended an uptrend that has already lifted it 15.85% in one month. The move matters because CRM is now pressing the upper edge of its recent trading range, which often tells investors less about where the stock has been and more about how much conviction remains behind the advance.
Trend & Price Action
The chart shows a stock that is still being carried by trend, not just by a single strong session. CRM is trading above SMA20 at 174.03 and above SMA50 at 171.69, with the shorter average now crossing above the longer one in a golden cross. In plain language, that crossover usually signals that recent buying has become strong enough to overtake the slower-moving longer-term trend. It does not guarantee more gains, but it does mean the market has shifted from recovery mode to a more established upward structure.
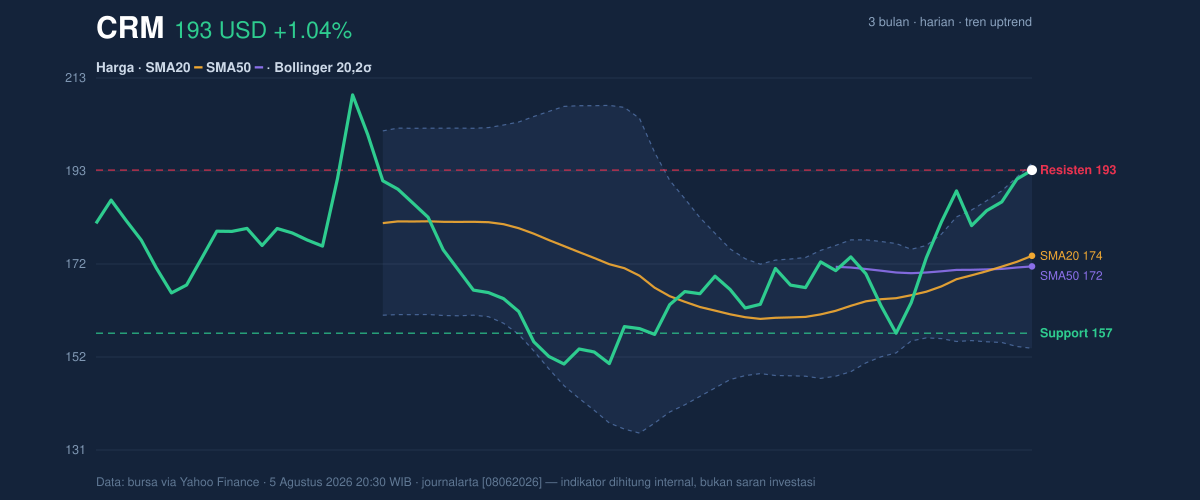
The slope of SMA20, at 3.07% over 5 days, reinforces that the trend is still rising rather than flattening out. CRM is also sitting at the top of its 20-hour support-resistance band, with support at 156.93 and resistance at 192.98. That places the stock at 100% of the recent range, which is a strong position, but also a position where fresh upside usually needs confirmation rather than assumption.
The broader range adds context. CRM’s 3-month high is 211.34 and the 3-month low is 146.32, so the stock is trading much closer to the upper end of that band than the lower end. That tells readers the market has already repriced a fair amount of optimism into the shares.
Oscillators & Momentum
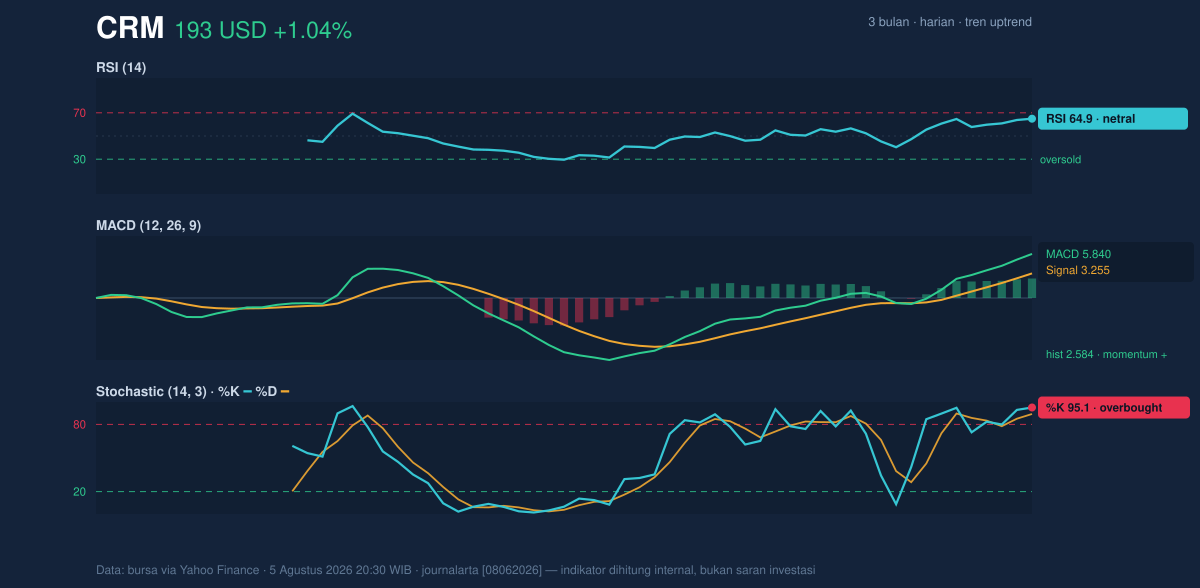
Momentum is constructive, but not cleanly comfortable. The RSI at 64.9 is still labeled neutral, which means the stock is not yet in the classic overbought zone, but it is close enough to that threshold to show appetite has become extended. The more pressing signal comes from Stochastic: %K at 95.1 and %D at 89.3 are both in overbought territory. That usually means the stock has been rising faster than its recent average pace, and short-term traders may already be crowded on the same side of the move.
The MACD at 5.840, above its signal line at 3.255, with a positive histogram of 2.584, says the trend still has upward momentum behind it. This is important because MACD is a trend-following gauge: when it stays above the signal line and the histogram is positive, buyers remain in control even if the move is getting stretched. In other words, the stock is not rolling over yet, but it is showing signs of being a little ahead of itself on the fastest oscillator.
Volatility & Volume
The Bollinger Bands show a market that is both strong and stretched. CRM is near the top band at 194.49, with %B at 96% and the band width at 23.5%, described as expanding. That combination usually means volatility is rising and price is leaning hard toward the upper boundary. When a stock spends time near the top band while the bands widen, it often signals a powerful trend — but also one that can become more sensitive to any disappointment.
The ATR(14) of 8.77, equal to 4.5% of price, confirms that daily swings are relatively large. For readers, ATR is a measure of how much a stock typically moves in a day; a higher reading means wider trading ranges and a greater chance of sharp pullbacks even inside an uptrend.
Volume does not fully confirm the latest push. The most recent volume of 9,560,200 is only 0.8× normal versus the 20-day average of 12,686,890. That suggests the advance is happening on lighter participation than usual, so the breakout has not yet been backed by a clear surge in trading activity. Still, OBV is rising, which implies the broader accumulation trend remains positive even if the last session was not especially heavy.
Key Levels & Scenarios
The key technical issue is whether CRM can hold above the recent ceiling it has just reached. With price at 192.98, the stock is testing the upper Bollinger band at 194.49 and the recent resistance at 192.98. A sustained move above that zone would suggest the market is willing to pay up for continued earnings and growth expectations. If price fails there, the first area to watch is the rising trend structure around SMA20 at 174.03, which also matches the Bollinger middle band.
The deeper support reference is 156.93. That level matters because it is the lower edge of the recent 20-hour range and sits much closer to the lower Bollinger band at 153.58. A break below that area would weaken the current uptrend narrative and suggest the market is no longer respecting the recent buying pattern.
Technical Verdict: HOLD (wait & see)
HOLD (wait & see)
- MACD remains positive, so the broader trend is still intact.
- Golden cross and price above SMA20/SMA50 show the structure is bullish.
- Stochastic is overbought and price is near the upper Bollinger band at 194.49, which raises short-term exhaustion risk.
Verdict invalidated if price breaks below 156.93.
- Ideal Entry Range: 174.03 to 156.93
- Exit Target: 194.49 to 211.34
- Stop Loss protection: below 153.58
In plain English: CRM is still trending higher, but it is already close to the top of its recent range and may need a pause before the next move.
Summary Data CRM
| Last price | 192.98 USD |
| Change 1 day / 5 days / 1 month | 1.04% / 2.44% / 15.85% |
| Trend / MA-cross | uptrend / golden |
| SMA20 / SMA50 | 174.03 / 171.69 |
| RSI (14) / Stochastic %K | 64.9 / 95.1 |
| Bollinger %B / ATR | 96% / 8.77 |
| Support / Resistance 20 days | 156.93 / 192.98 |
| Data as of | 5 Agustus 2026 20:30 WIB |



