HD Stock Gains 1.41% Today, Testing Key Resistance
On Agustus 6, 2026: price 353.14 USD, trend sideways, RSI 60.8, support 324.71, resistance 353.14. technical analysis of hd stock. HD Stock Gains — full…

Home Depot shares on the NYSE rose to 353.14 USD from 348.24 in the latest session, extending a 1.41% daily gain and pushing the stock to the top of its recent trading range, according to market data compiled from Yahoo Finance. The move leaves HD above both its short- and medium-term trend markers, but the message from the chart is more nuanced than a simple breakout: price is stretched, momentum is still positive, and participation has not fully caught up. That combination often signals a market that is advancing, but not yet fully convinced.
Trend & Price Action
As shown in the chart, HD is trading above the SMA20 at 338.23 and above the SMA50 at 333.05, which keeps the broader technical structure constructive even though the trend label remains sideways. The key detail is that the SMA20 slope is -0.50% over 5 days: that tells readers the short-term average is still drifting lower, so the stock is rising inside a range rather than accelerating into a clean trend. In plain English, the price is improving faster than the trendline is.
The stock is also sitting at 100% of its 20-hour range, with 353.14 matching the listed resistance, which means buyers have already pushed price to the upper boundary of the current band. That is powerful in the short term, but it also makes the next move more important than the last one. If the stock can hold above this area, the market may be signaling acceptance at a higher level. If not, the move can quickly revert back into the range.
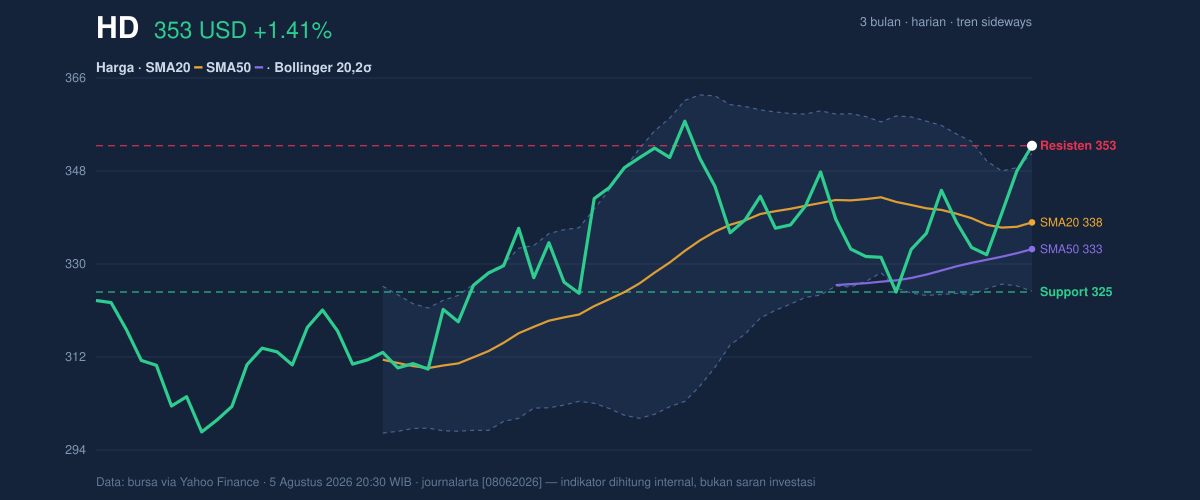
The broader context matters too: HD is trading close to its 3-month high of 358.85, well above the 3-month low of 289.10. That tells us the recovery from the lower end of the range has already happened; what remains is whether the stock can convert that recovery into sustained upward structure.
A rally is only durable when it stops looking like a rally.
Oscillators & Momentum
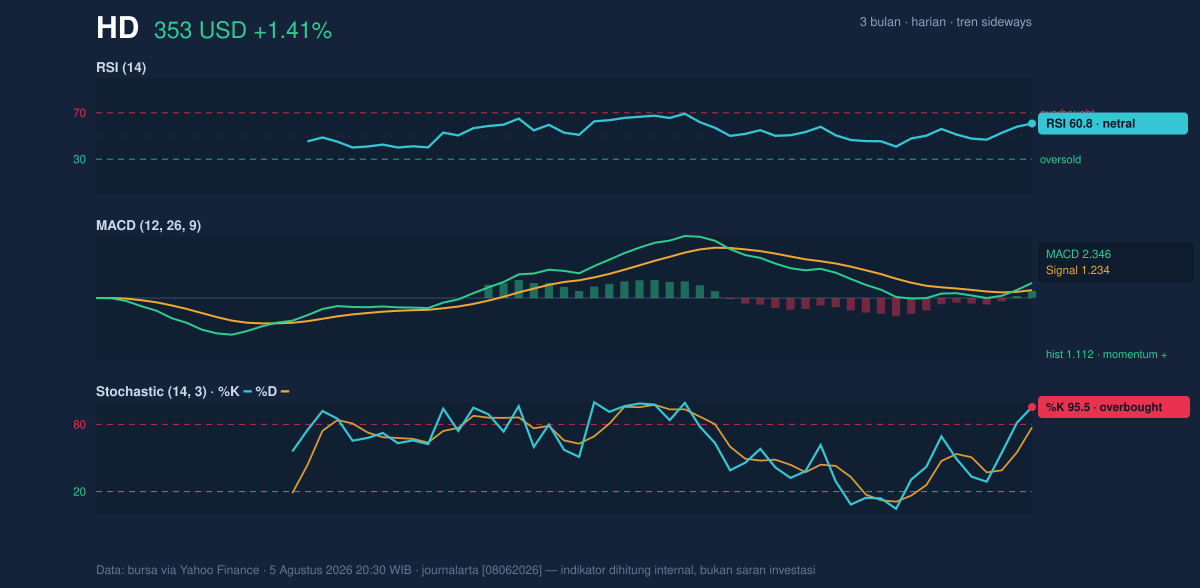
Momentum indicators are sending a mixed but still supportive message. The RSI at 60.8 is still neutral, which means the stock is not yet in the classic overbought zone even after the recent advance. RSI in this area usually suggests the move has room left, but it also implies the market is no longer cheap on a short-term basis. It is a “healthy” reading only if price keeps consolidating or nudging higher without an abrupt reversal.
The more immediate caution comes from the Stochastic %K at 95.5 versus %D at 77.3, which is clearly overbought. Stochastic is faster than RSI and often flags exhaustion earlier, so this reading says the latest push may be running ahead of itself. When %K is this far above %D, the stock has been moving quickly enough that traders may start locking in gains. That does not automatically mean a reversal, but it does mean the next upside leg may need a pause first.
By contrast, the MACD at 2.346 remains above the signal line at 1.234, with a histogram of 1.112. That is the cleanest confirmation in the set: MACD is still positive, and the histogram shows the gap between momentum and its trigger line is wide enough to suggest the trend impulse has not disappeared. In simple terms, the stock still has upward energy, even if it is stretched in the short run.
Volatility & Volume
The Bollinger Band structure adds an important layer. HD is trading above the upper Bollinger band at 351.59, with %B at 106%, which means price is not merely near the top of its recent volatility envelope; it is slightly beyond it. That often happens when a stock is strong, but it can also indicate an overextended move that needs either consolidation or a pullback to re-enter the band. The fact that the band width is 7.9% and is narrowing matters because squeezes often precede larger moves. So the chart is not just saying “overbought”; it is also saying “potentially ready to move more sharply.”
Volume, however, tempers the enthusiasm. Last trade volume of 3,139,100 was below the 20-day average of 3,812,275, or about 0.8× normal. That means the latest advance was not backed by especially heavy turnover. In technical terms, the move has price acceptance but not full conviction. On the positive side, OBV is rising, which indicates that the broader accumulation trend still leans upward even if the latest session was not a volume surge.
Key Levels & Scenarios
The immediate battleground is straightforward: 353.14 is the current resistance and latest price, while 324.71 is the 20-hour support. Between those two points, the market is effectively deciding whether the recent strength becomes a new base or just a stretched swing. Because the stock is already at the top of its range and above the upper Bollinger band, the first reaction lower would not be surprising. What matters is whether that reaction holds above the middle of the structure near the SMA20 at 338.23.
If price holds above 338.23 after any pullback, the chart would still look constructive, with the upper band at 351.59 likely acting as a pivot rather than a ceiling. If price slips below 324.71, the short-term advance loses its immediate base and the case for continued upside weakens materially.
Technical Verdict: HOLD (wait & see)
HOLD (wait & see)
- MACD remains positive, with the line above signal and a healthy histogram, so the underlying impulse is still supportive.
- RSI at 60.8 is not overheated, but Stochastic at 95.5/77.3 shows the move is short-term stretched.
- Price above SMA20 and SMA50 keeps the structure constructive, while %B at 106% warns the stock is trading beyond the upper Bollinger band.
- Verdict invalidated if price falls below 324.71.
- Ideal Entry Range: 338.23 to 324.71
- Exit Target: 358.85
- Stop Loss protection: below 324.71
For non-traders, this means the stock still looks technically healthy, but it is already extended enough that the next move matters more than the last one.
Summary Data HD
| Last price | 353.14 USD |
| Change 1 day / 5 days / 1 month | 1.41% / 4.40% / 5.04% |
| Trend / MA-cross | sideways / none |
| SMA20 / SMA50 | 338.23 / 333.05 |
| RSI (14) / Stochastic %K | 60.8 / 95.5 |
| Bollinger %B / ATR | 106% / 9.18 |
| Support / Resistance 20 days | 324.71 / 353.14 |
| Data as of | 5 Agustus 2026 20:30 WIB |



