Momentum Weakens, LLY Stock Gains 4.86% Today
On Agustus 6, 2026: price 1,169.86 USD, trend sideways, RSI 51.3, support 1,115.68, resistance 1,220.66. technical analysis of lly stock.

Eli Lilly shares on the NYSE rose 4.86% to 1,169.86 USD on 5 August 2026, but the move landed inside a market structure that still looks hesitant rather than decisive. As shown in the chart, the stock is trading below its SMA20 at 1,172.55 while sitting above the SMA50 at 1,152.95, a positioning that usually signals a market trying to stabilise after a short pullback, not one that has fully re-established upward control.
Trend & Price Action
The broader picture remains sideways, and that matters more than the one-day bounce. A sideways trend means buyers and sellers are still fighting for direction, with neither side able to sustain a clean breakout. The SMA20 slope of -1.46% over 5 days shows the short-term average is still edging down, which suggests recent momentum has been softer than the longer trend, even though the stock has not broken into a more serious downtrend. The lack of a new MA-cross also tells traders there has been no fresh moving-average signal to confirm a trend shift.
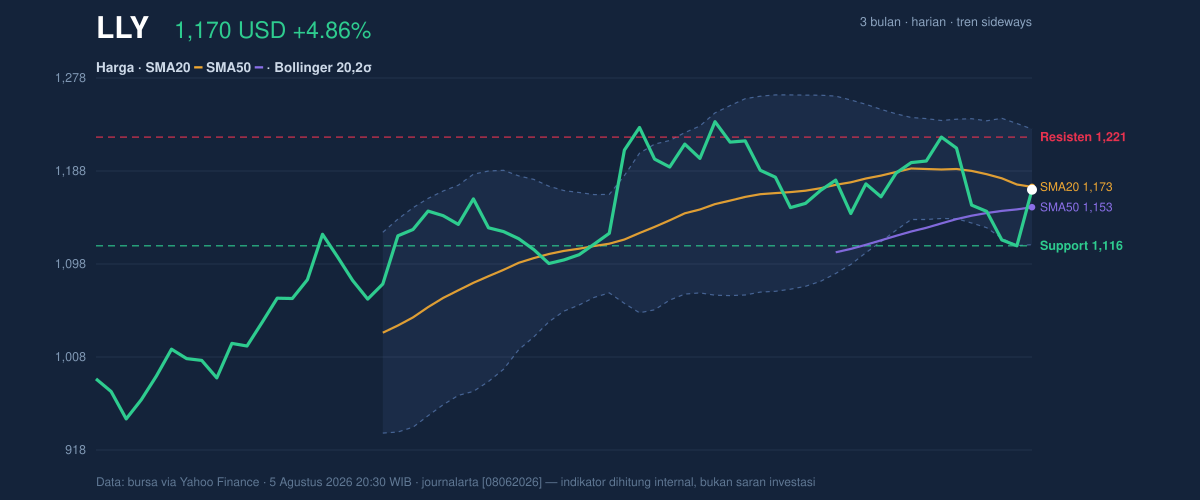
Price is sitting around 52% of the 20-hour range, essentially in the middle of the recent battleground. That is important because mid-range trading often reflects indecision: the market has not rejected lower prices strongly enough to form a clean base, but it has also not pushed convincingly toward the upper band. The 20-hour support at 1,115.68 remains the nearest floor, while 20-hour resistance at 1,220.66 caps the immediate upside. In plain terms, the stock is boxed in, and the current rally has not yet proved it can escape that box.
The Bollinger Bands reinforce that reading. With the middle band at 1,172.55, Eli Lilly is trading almost exactly at the mean, which is often where price pauses after a swing. The upper band at 1,228.38 marks the area where enthusiasm would need to stretch further to look like a genuine breakout, while the lower band at 1,116.72 sits close to support. The 9.5% band width is normal, not compressed, so the setup does not point to an imminent volatility squeeze. Instead, it suggests the stock already has room to move, but needs a catalyst or stronger participation to do it.
Oscillators & Momentum
Momentum signals are mixed, and that is the key message from the chart. The RSI at 51.3 is neutral, which means the stock is neither overbought nor oversold. That is often the signature of a market waiting for confirmation. The Stochastic %K at 49.4 and %D at 21.6 also sit in neutral territory, but the gap between them hints that short-term upward pressure has improved from a weaker level. Still, neutral oscillators do not confirm trend strength on their own; they simply show the stock has room to move in either direction.
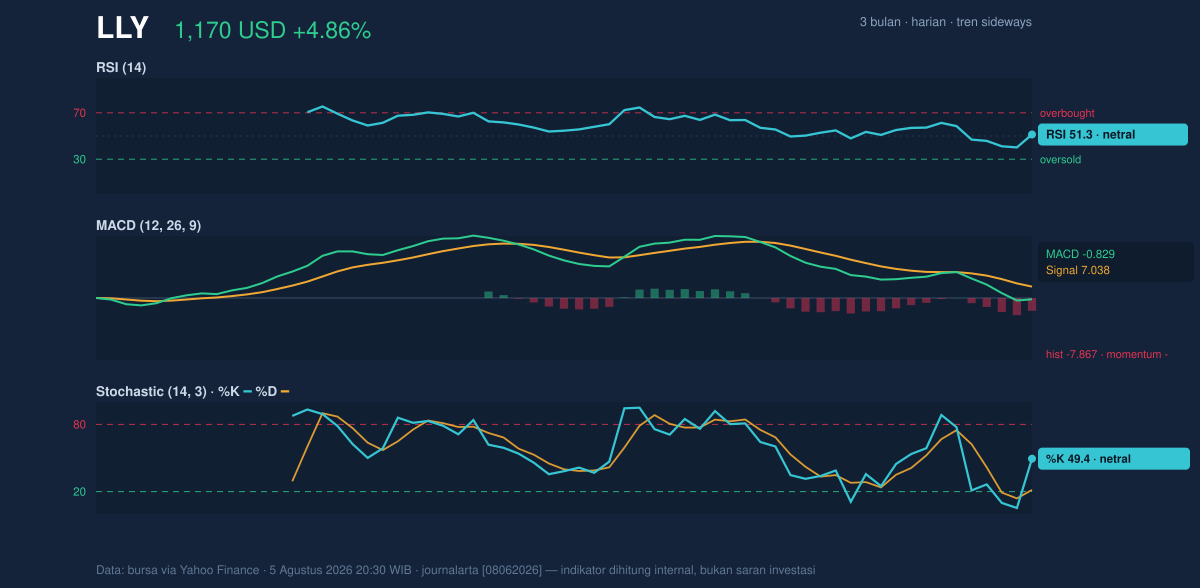
The more cautionary signal comes from MACD. The MACD at -0.829, below the signal line at 7.038, with a histogram of -7.867, points to negative momentum underneath the surface. In practical terms, that means the recent bounce is not yet backed by strong trend acceleration. A positive daily move can coexist with negative MACD when the stock is rebounding inside a larger pause. That is exactly the kind of setup traders watch for confirmation rather than chase.
Volatility & Volume
Volatility is present, but not extreme. The ATR(14) at 40.22, or 3.4% of price, suggests the stock can still move meaningfully in either direction during a normal session. That matters because a break of support or resistance would not likely be a slow grind; it could travel quickly once the range gives way. The current normal Bollinger width supports that view: the market is active enough to move, but not so stretched that it is already in panic or euphoria.
Volume adds a more interesting twist. Last trade volume of 6,435,100 was about 2.4 times the 20-hour average of 2,630,880, which shows the move had real participation. A surge like that usually means the day’s price action was not random noise. But the OBV is falling, and that is the caution flag. OBV, or on-balance volume, tracks whether volume is accumulating on up days or leaking away over time. A falling OBV while price rises can mean buyers are still not fully committed, so the rally may be more of a short-covering bounce than a broad accumulation phase.
Key Levels & Scenarios
The immediate map is clear. 1,115.68 is the first support to watch, and it lines up closely with the lower Bollinger band at 1,116.72. If that area fails, the stock would be signalling that the recent rebound has lost its base. On the upside, 1,220.66 is the first resistance, with the Bollinger upper band at 1,228.38 nearby. A move through that zone would tell the market the stock is no longer just trading in the middle of the range.
The 3-month range also gives context. The high at 1,249.45 is not far above resistance, which means the stock does not need an enormous move to revisit the upper end of its recent history. But the 3-month low at 943.26 is still far away, reminding readers that this is not a fragile name in collapse; it is a large-cap stock consolidating after a wide prior swing. As shown in the chart, the next directional clue will likely come from whether price can hold above the mid-band and reclaim the nearby resistance zone.
Technical Verdict: HOLD (wait & see)
- Reason 1: RSI 51.3 and Stochastic 49.4 / 21.6 are neutral, so momentum does not yet confirm a breakout.
- Reason 2: MACD -0.829 with a -7.867 histogram shows underlying momentum is still negative despite the daily bounce.
- Reason 3: Price is below SMA20 at 1,172.55 but above SMA50 at 1,152.95, matching a range-bound setup rather than a clean trend.
- Verdict invalidated if price breaks below 1,115.68, because that would weaken the current support base and shift the balance back toward sellers.
- Ideal Entry Range: 1,152.95 to 1,172.55
- Exit Target: 1,220.66 to 1,228.38
- Stop Loss protection: below 1,115.68
In plain English: the stock has stopped falling for now, but it has not yet shown enough strength to prove the bounce is more than a pause.
“The market is still waiting for Lilly to prove that this rebound has legs.”
Summary Data LLY
| Last price | 1,169.86 USD |
| Change 1 day / 5 days / 1 month | 4.86% / -3.32% / -3.78% |
| Trend / MA-cross | sideways / none |
| SMA20 / SMA50 | 1,172.55 / 1,152.95 |
| RSI (14) / Stochastic %K | 51.3 / 49.4 |
| Bollinger %B / ATR | 48% / 40.22 |
| Support / Resistance 20 days | 1,115.68 / 1,220.66 |
| Data as of | 5 Agustus 2026 20:30 WIB |


