Momentum Weakens, NKE Stock Gains 2.22% Today
On Agustus 6, 2026: price 42.45 USD, trend downtrend, RSI 48.6, support 40.99, resistance 44.57. technical analysis of nke stock. Momentum Weakens — full…

Nike’s shares rose 2.22% to $42.45 in the latest session, according to Yahoo Finance data cited at 20:30 WIB on 5 August 2026, but the move still leaves the stock below both its short-term and medium-term trend markers. That matters because a one-day bounce can look encouraging while the broader price structure continues to point lower; in technical terms, the market is still trading under its SMA20 at $42.76 and SMA50 at $43.41, so buyers have not yet reclaimed control of the trend.
Trend & Price Action
The chart shows Nike sitting in a downtrend, with the SMA20 slope negative at -0.69% over 5 days. That slope is a simple way of measuring whether the recent average price is rising or falling; here, it is still falling, which means the stock has not yet built a stable base. The latest close at $42.45 is also in the lower half of the recent trading band, with price at only 41% of the $40.99 to $44.57 20-hour range. In plain English, Nike is not pressing the upper edge of its range; it is still working its way back from the middle.
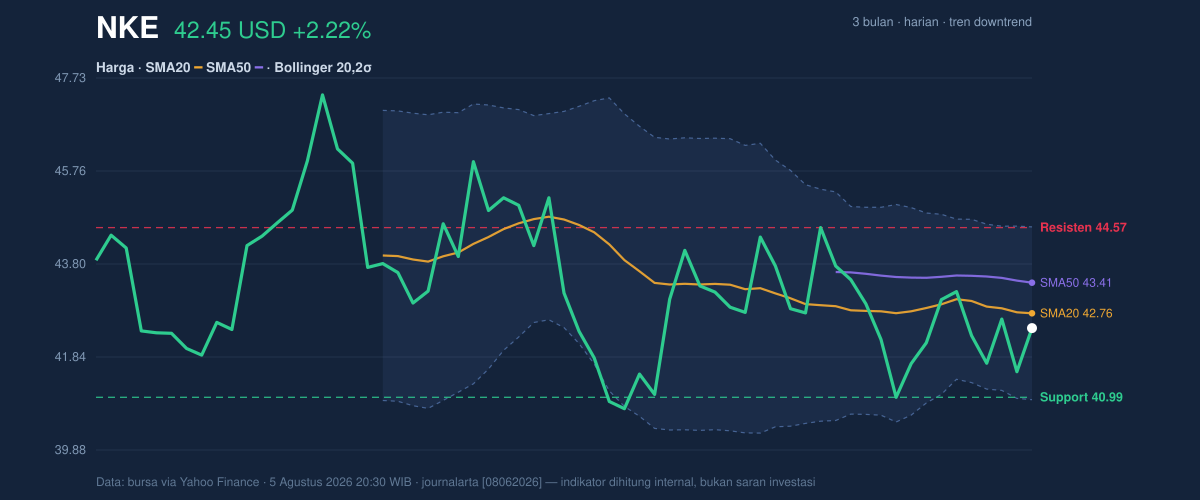
The broader context is equally important. Nike is trading above its 3-month low of $40.00 but still well below the 3-month high of $47.65, which tells you the stock has recovered from the floor but has not repaired the damage done during the prior slide. There is no fresh moving-average crossover, so the market has not produced the kind of trend signal that usually marks a cleaner reversal. For now, the chart is saying: stabilizing, but not yet reversing.
Oscillators & Momentum
Momentum indicators are mixed, which is often what you see when a stock is trying to stop falling rather than start a new advance. The RSI at 48.6 is neutral, meaning the stock is neither stretched to the upside nor oversold to the downside. The Stochastic %K at 41.0 and %D at 35.4 are also neutral, but they sit modestly above the lower part of the scale, suggesting the rebound has some life without yet showing strong follow-through. The key point is that these oscillators are not confirming a powerful breakout; they are showing a market that is still searching for direction.
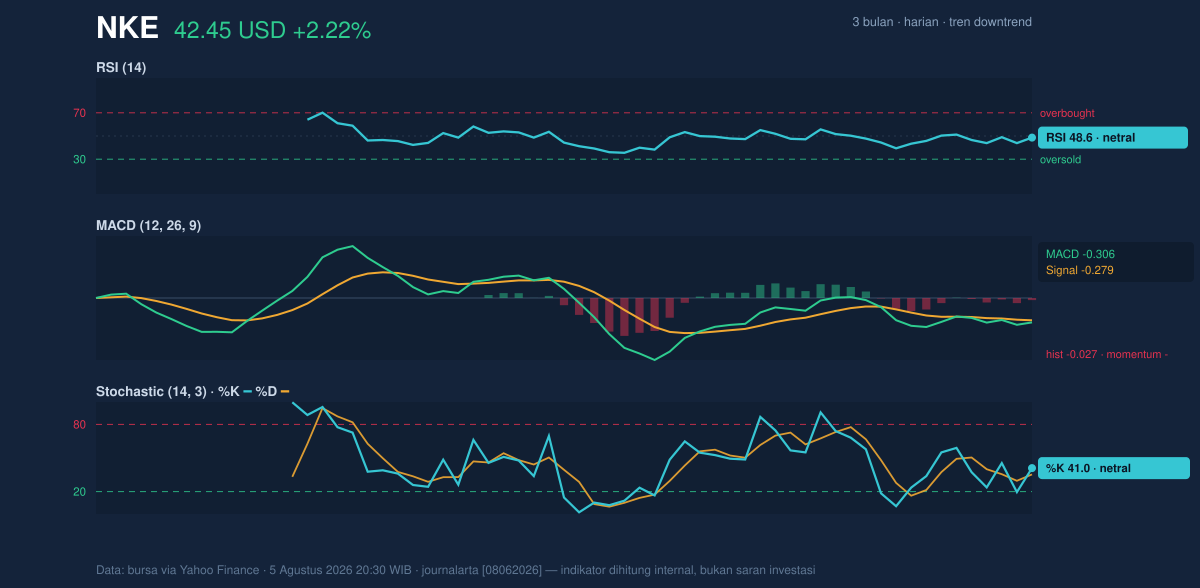
The more cautionary signal comes from MACD at -0.306, below its signal line at -0.279, with a histogram of -0.027. MACD is a trend-following momentum tool, and when it remains below the signal line it usually means downside pressure is still slightly stronger than upside conviction. The histogram is close to flat, so the bearish edge is not dramatic, but it is still negative. That combination matters: RSI and Stochastic say “not oversold,” while MACD says “the recovery has not yet won the argument.”
Volatility & Volume
Bollinger Bands help frame where price sits relative to its recent statistical range, and here the picture is balanced rather than extreme. Nike’s %B at 41% places the stock below the middle of the band structure, while the band width of 8.5% is described as normal. That means volatility is not compressed into a classic squeeze, nor is it expanding in a panic-like move; the market is in a regular trading regime, which often produces more measured swings than explosive ones. The ATR(14) at 1.29, or about 3.0% of price, reinforces that reading: daily movement is active enough to matter, but not unusually wild.
Volume adds a constructive note. The latest turnover of 22,077,200 shares is about 1.2x the 20-hour average of 18,470,940, and OBV is rising. OBV, or on-balance volume, tracks whether trading pressure is accumulating on up days versus down days. A rising OBV alongside heavier-than-normal volume suggests real participation behind the bounce, not just a thin move. That is important because price recoveries supported by volume tend to be more credible than those built on quiet trading.
Still, participation is not the same as trend reversal.
Key Levels & Scenarios
The nearest technical map is clear. Support sits at $40.99, with the broader floor near the 3-month low of $40.00. On the upside, resistance is $44.57, just under the Bollinger upper band at $44.58. That alignment matters: it means the stock is approaching a zone where prior selling pressure and statistical resistance converge. If Nike can clear that area, the chart would begin to look less like a dead-cat bounce and more like a genuine attempt to reclaim the range. If it fails there, the stock remains trapped beneath the trend markers.
The most useful way to read the setup is conditional. A move and hold above $44.57 would improve the technical tone because it would push price through resistance and toward the SMA50 at $43.41’s higher ground, while a slip back below $40.99 would expose the $40.00 low again and weaken the current base-building narrative. As shown in the chart, Nike is sitting in the middle of a fight between stabilization and continuation of the downtrend.
Technical Verdict: HOLD (wait & see)
HOLD (wait & see)
- The downtrend remains intact, with price below the SMA20 at $42.76 and SMA50 at $43.41.
- MACD is still negative, which means upside momentum has not yet overtaken the broader drift lower.
- Volume is supportive and OBV is rising, but the stock is still below the key $44.57 resistance zone.
- Verdict invalidated if price breaks below $40.99, because that would put the recent support floor back under pressure and reopen the path toward $40.00.
- Ideal Entry Range: $40.99 to $42.76, where support and the Bollinger middle band overlap.
- Exit Target: $44.57 to $44.58, the resistance and upper Bollinger band area.
- Stop Loss Protection: Below $40.99, with the deeper reference point at $40.00.
For non-traders: the chart says Nike is trying to stabilize, but it has not yet proved that the decline is over.
“I want to see the stock earn back that resistance, because until then this is only a recovery attempt, not a repair.”
Summary Data NKE
| Last price | 42.45 USD |
| Change 1 day / 5 days / 1 month | 2.22% / -1.78% / -1.03% |
| Trend / MA-cross | downtrend / none |
| SMA20 / SMA50 | 42.76 / 43.41 |
| RSI (14) / Stochastic %K | 48.6 / 41.0 |
| Bollinger %B / ATR | 41% / 1.29 |
| Support / Resistance 20 days | 40.99 / 44.57 |
| Data as of | 5 Agustus 2026 20:30 WIB |


