UNH Testing Support Level: Stock Gains 1.28% (Agustus 6, 2026)
On Agustus 6, 2026: price 412.75 USD, trend sideways, RSI 46.7, support 407.55, resistance 436.35. technical analysis of unh stock. UNH Testing Support Level —…

UnitedHealth Group shares on the NYSE were trading at 412.75 USD after rising 1.28% on the day, but the move still leaves the stock below its short-term trend line and near the lower end of its recent range. That matters because the latest bounce is happening inside a market that is still trying to decide whether it has enough strength to leave a sideways pattern behind.
Trend & Price Action
The chart shows a stock that is not in a clean uptrend or downtrend, but in a sideways phase, with the SMA20 at 422.53 sitting above the current price and the SMA50 at 411.79 just below it. In plain terms, the 20-day average is still acting like a ceiling, while the 50-day average is acting like nearby support. That setup often signals indecision: short-term traders are still selling into strength, but longer-term holders have not fully lost control.
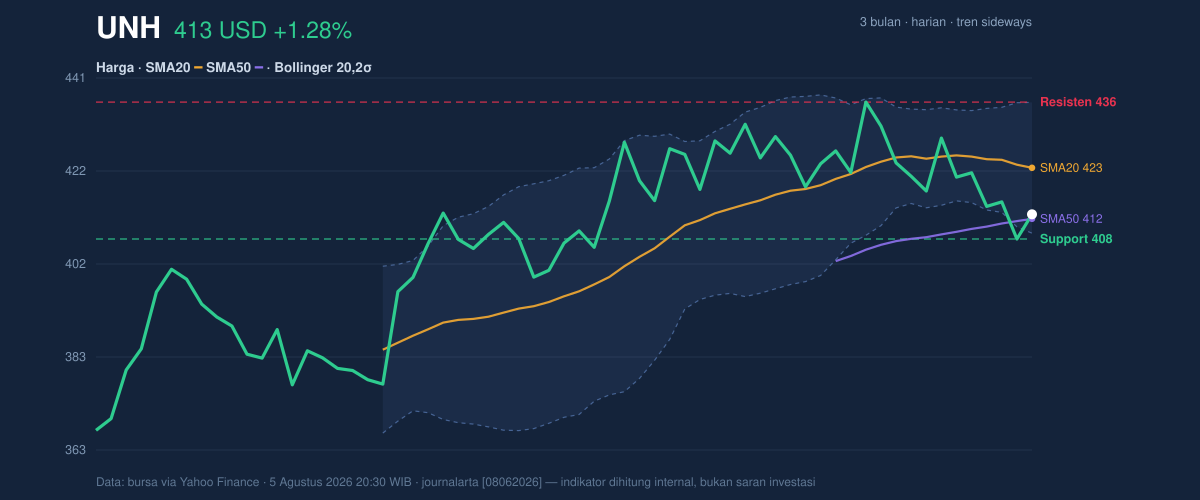
The slope of the SMA20 at -0.61% over 5 days reinforces that picture. A falling short-term average usually means recent prices have been drifting lower, even if the latest session is positive. The absence of a fresh MA-cross also means there is no new trend signal from the moving averages yet, so the market is still waiting for confirmation rather than committing to a direction.
The stock is also trading at 18% of its 20-day range, with support at 407.55 and resistance at 436.35. That positioning is important: it shows the price is much closer to the lower boundary than the upper one, which makes the recent rebound look more like a test of support than a full recovery. The broader 3-month range of 461.62 to 358.25 shows there is still room on both sides, but not much evidence yet that the market has chosen a new direction.
Oscillators & Momentum
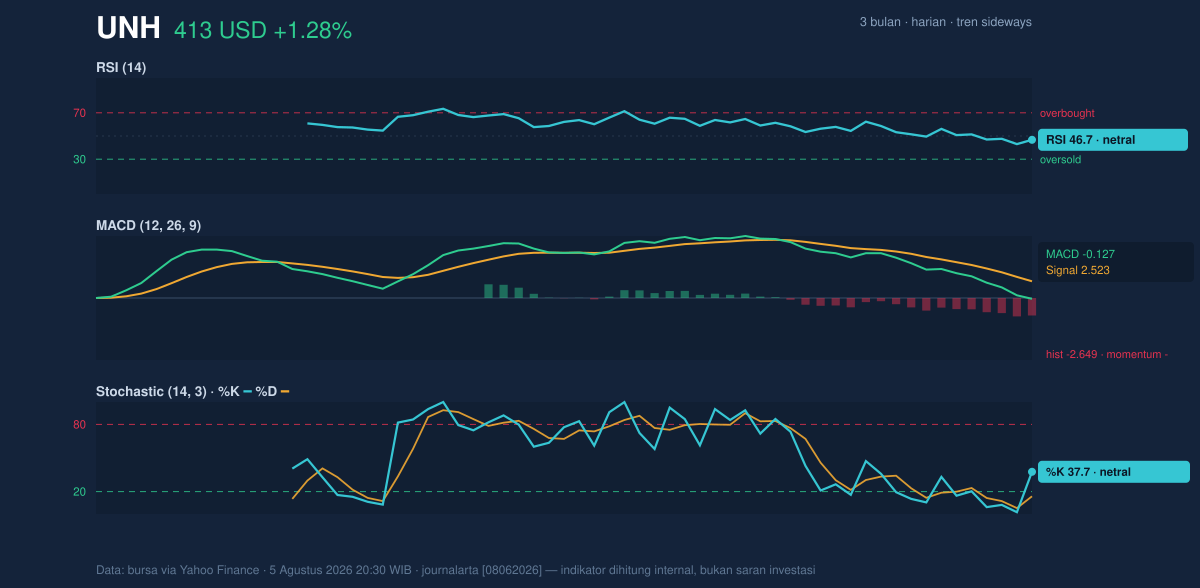
Momentum signals are mixed, but not in a way that favors immediate trend acceleration. The RSI at 46.7 is neutral, which means the stock is neither overbought nor oversold. That is often what you see in a stock that is consolidating: buyers and sellers are roughly balanced, but neither side has enough force to take control.
The Stochastic %K at 37.7 and %D at 15.8 are also neutral, though the gap between the two suggests the short-term bounce has improved from weaker levels. Stochastic is useful for spotting turning points, and here it hints at recovery from a depressed area without yet proving a durable reversal.
The more cautionary signal comes from the MACD at -0.127 versus its signal line at 2.523, with a histogram of -2.649. That combination means downside momentum is still dominant beneath the surface, even after the day’s gain. In other words, the stock can rise for a session while its broader momentum remains negative. That is the kind of divergence traders watch closely: price is trying to stabilize, but the trend engine has not turned bullish.
Volatility & Volume
The Bollinger Bands are telling a different part of the story. With the upper band at 436.29, the middle band at 422.53, and the lower band at 408.77, the stock is sitting close to the lower band, with %B at 14%. That means price is trading near the bottom of its recent volatility envelope, a zone that often reflects weakness but can also precede a rebound if sellers run out of steam.
More importantly, the band width is only 6.5%, described as a squeeze. A squeeze means volatility has contracted, and that often comes before a sharper move. It does not tell you direction, only that the market is storing energy. In this case, the direction will likely be decided by whether the stock can reclaim the middle band at 422.53 or slips back toward the lower support around 408.77 and 407.55.
Volume does not yet confirm a strong breakout attempt. Last volume was 5,397,100, slightly below the 20-day average of 5,543,455, or about 1.0× normal. That means the latest price move came without unusually heavy participation. When a stock rises on ordinary volume while OBV is falling, it suggests accumulation is not yet obvious. In practical terms, the rally is still unproven.
Key Levels & Scenarios
The immediate map is straightforward. 407.55 is the nearest support and also the lower edge of the recent range. A break below that level would undermine the current bounce and expose the stock to a retest of the lower part of its broader 3-month range. On the upside, 422.53 is the first meaningful reclaim point because it is both the SMA20 and the Bollinger middle band. If the price can get back above that zone, it would show short-term momentum is improving. Above that, 436.35 and 436.29 mark the next resistance area, where sellers have recently had the upper hand.
The fact that the stock is trading below the SMA20 but just above the SMA50 is the key tension. That often creates a “decision zone” where the market either snaps back toward the average or fails and rolls over again. With ATR at 11.97, or 2.9% of price, the stock has enough daily movement to make that decision quickly once it starts.
Technical Verdict: HOLD (wait & see)
HOLD (wait & see)
- RSI 46.7 and Stochastic 37.7 / 15.8 are neutral, so momentum is not strong enough to confirm a new trend.
- MACD -0.127 with a -2.649 histogram still points to negative momentum, even though price bounced.
- The Bollinger squeeze and price near lower-band support suggest a move is coming, but direction is not yet confirmed.
Verdict invalidated if price falls below 407.55.
- Ideal Entry Range: 408.77 to 422.53
- Exit Target: 436.29 to 436.35
- Stop Loss Protection: below 407.55
For non-traders, this means the stock is near a technical turning point, but the charts have not yet shown a clear winner between buyers and sellers.
The next scheduled test is whether UnitedHealth can reclaim 422.53 and hold it, or whether the market sends it back toward 407.55.
Summary Data UNH
| Last price | 412.75 USD |
| Change 1 day / 5 days / 1 month | 1.28% / -1.86% / -3.02% |
| Trend / MA-cross | sideways / none |
| SMA20 / SMA50 | 422.53 / 411.79 |
| RSI (14) / Stochastic %K | 46.7 / 37.7 |
| Bollinger %B / ATR | 14% / 11.97 |
| Support / Resistance 20 days | 407.55 / 436.35 |
| Data as of | 5 Agustus 2026 20:30 WIB |


