CVX Stock Gains 1.51%, Momentum Weakens In Focus
On Agustus 7, 2026: price 189.23 USD, trend uptrend, RSI 53.7, support 176.40, resistance 196.83. technical analysis of cvx stock. CVX Stock Gains — full…

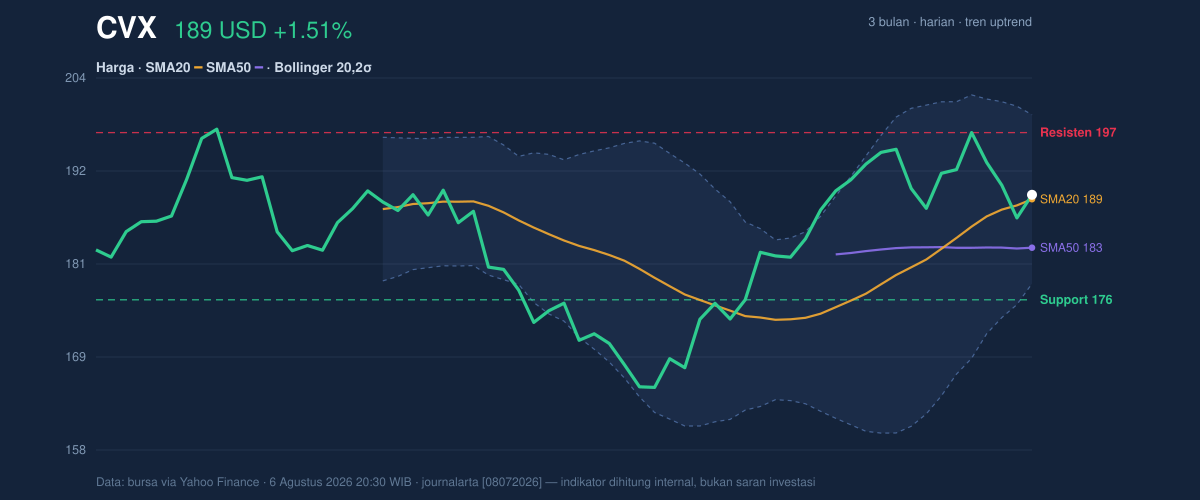
Chevron’s shares rose to 189.23 USD on the NYSE, up from 186.41 at the previous close, but the message in the tape is more nuanced than the headline gain. The stock is still in an uptrend, trading above its SMA20 at 188.70 and well above its SMA50 at 182.76, which tells investors the medium-term structure remains constructive. Yet momentum is no longer fully synchronized with price: the stock is holding near the middle of its Bollinger band, while the MACD has slipped below its signal line, a sign that the latest advance is losing some internal force even as the broader trend stays intact.
Trend & Price Action
As shown in the chart, Chevron is sitting in the upper half of its recent range but not at an extreme. The stock is trading at about 63% of the 20-day range, with 20-day support at 176.40 and 20-day resistance at 196.83. That positioning matters: it suggests buyers have enough control to keep price above the short-term average, but not enough to press cleanly into the upper boundary of the range. The SMA20 slope of 2.57% over 5 days confirms the trend is still rising, and the share price is above the Bollinger middle band at 188.70, which often acts as a pivot between positive and neutral territory.
The broader frame is also helpful. Chevron’s 3-month high of 198.87 is close enough to matter, while the 3-month low of 164.78 shows how far the stock has already recovered. That distance from the low indicates the market has re-rated the shares higher, but the proximity to the recent high also means overhead supply could appear near the upper 190s.
A small gain can still hide a crowded pause.
Oscillators & Momentum
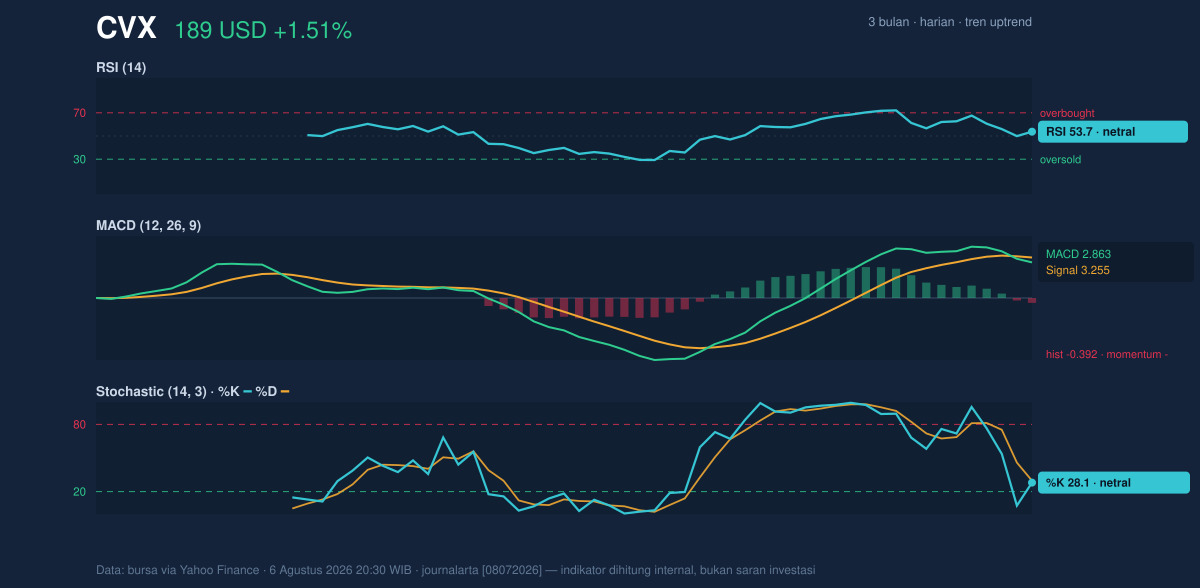
The momentum picture is mixed rather than bearish. The RSI at 53.7 is neutral, which means Chevron is neither overbought nor oversold and still has room to move in either direction. The Stochastic %K at 28.1 and %D at 29.7 sits near the lower end of neutral, often read as a market that has cooled after a rise and is looking for direction. In plain language, that is not a sell signal by itself; it says the stock has lost some short-term urgency.
The more important warning comes from MACD. Chevron’s MACD at 2.863 is below its signal at 3.255, leaving a histogram of -0.392. That negative histogram means the trend is still positive on a longer lens, but the pace of gains has slowed enough that recent price action is no longer outpacing the trend line behind it. In a stock already near resistance, that kind of fade can matter.
Neutral oscillators are not a problem; they are a warning that conviction has thinned.
Volatility & Volume
Chevron’s ATR(14) of 4.59, equal to 2.4% of price, points to moderate volatility. That means daily swings are large enough to matter, but not so wide that the chart is in panic mode. The Bollinger band width of 10.9% is described as normal, so there is no squeeze signaling an imminent breakout, nor an expansion signaling a disorderly move. Price is at a %B of 53%, essentially near the middle of the envelope, which reinforces the idea of a market that is balanced rather than stretched.
Volume does not yet confirm a fresh breakout. Trading came in at 7,180,100 versus a 20-day average of 7,502,990, or about 1.0× normal. That is close enough to average to suggest participation is present, but not strong enough to prove conviction. More telling is that OBV is falling. On-balance volume tracks whether volume is flowing into up days or down days; when it declines while price is still elevated, it often implies that the rally is not being broadly supported beneath the surface.
Key Levels & Scenarios
The key battleground is between 176.40 support and 196.83 resistance. If Chevron can push through the upper end of that band, the chart would begin to challenge the 3-month high at 198.87, which is the next obvious reference point on the chart. If it fails to hold the short-term average, the first sign of damage would be a drift back toward the SMA20 at 188.70; a deeper loss of that zone would put the lower band at 178.38 and then 176.40 into focus.
The current setup is therefore less about a clean trend acceleration and more about whether the stock can convert a stable uptrend into a stronger breakout. Right now, the chart does not show that confirmation.
Technical Verdict: HOLD (wait & see)
HOLD (wait & see)
- The price is above the SMA20 and SMA50, so the larger trend is still positive.
- The RSI is neutral and the Stochastic is also neutral, which suggests no strong momentum edge either way.
- The MACD histogram is negative and OBV is falling, so the recent advance lacks full confirmation from momentum and participation.
Verdict invalidated if price breaks below 176.40.
- Ideal Entry Range: 188.70 to 178.38, where the SMA20 and lower Bollinger band may act as support.
- Exit Target: 196.83 to 198.87, the resistance zone and nearby 3-month high.
- Stop Loss Protection: below 176.40, the 20-day support level.
In plain English: Chevron is still trending higher, but the stock is pausing near resistance and needs stronger momentum before the move looks convincing.
Summary Data CVX
| Last price | 189.23 USD |
| Change 1 day / 5 days / 1 month | 1.51% / -1.60% / 8.72% |
| Trend / MA-cross | uptrend / none |
| SMA20 / SMA50 | 188.70 / 182.76 |
| RSI (14) / Stochastic %K | 53.7 / 28.1 |
| Bollinger %B / ATR | 53% / 4.59 |
| Support / Resistance 20 days | 176.40 / 196.83 |
| Data as of | 6 Agustus 2026 20:30 WIB |


