MSFT Stock Gains 2.54%, RSI Overbought In Focus
On Agustus 7, 2026: price 499.86 USD, trend uptrend, RSI 78.1, support 381.58, resistance 499.86. technical analysis of msft stock. MSFT Stock Gains — full…

Microsoft shares on Nasdaq rose to 499.86 USD on 6 August 2026, extending a sharp run that has pushed the stock to the top of its recent trading band and within reach of its 3-month high of 501.56. The move matters because it is happening with the stock already far above its short- and medium-term averages, a sign that momentum is no longer just recovering — it is pressing into stretched territory.
The gain is not modest. Microsoft is up 2.54% on the day, 10.81% over 5 days and 30.05% in 1 month, which tells investors the rally has broadened beyond a single session. In plain terms, the chart is not drifting higher; it is accelerating. That usually attracts trend-following flows, but it also raises the risk that the move becomes vulnerable to a pause if buyers hesitate near resistance.
Trend & Price Action
The longer message from the chart is bullish. Microsoft is trading above SMA20 at 418.09 and SMA50 at 405.27, while the golden cross — where the 20-day average has moved above the 50-day average — confirms that the short-term trend has overtaken the medium-term trend. As shown in the chart, that alignment is typically read as a constructive structure because it means recent prices have been strong enough to pull the faster average above the slower one.
The slope of SMA20 at 6.34% over 5 days reinforces that view. A rising average is more informative than a single strong close: it shows the trend is being sustained, not just spiking intraday. Microsoft is also sitting at 100% of its 20-hour range and directly at 20-hour resistance of 499.86, which is a subtle but important signal. It means the stock has pushed to the edge of the short-term range rather than building room underneath it.
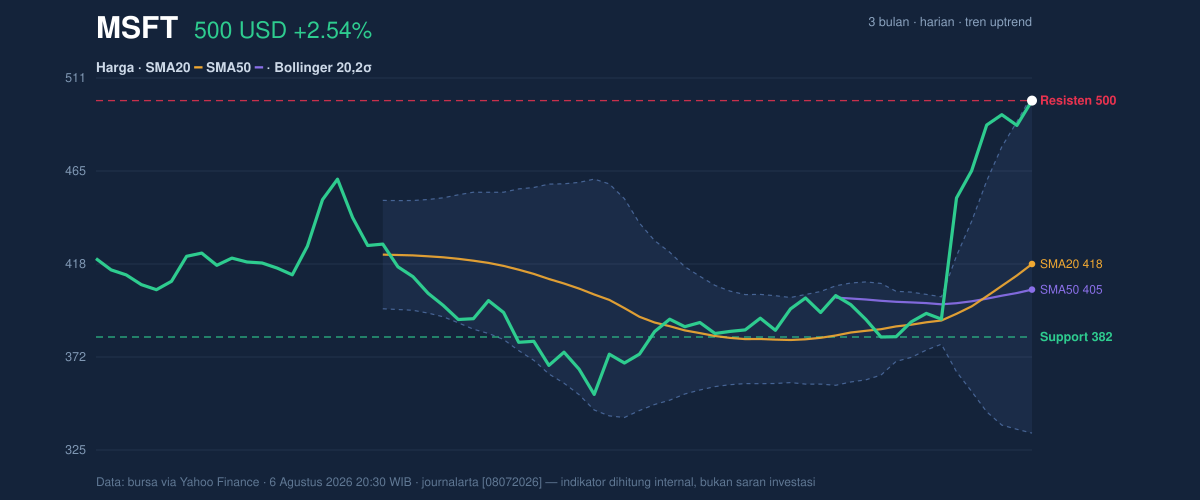
The Bollinger Bands add a caution flag to that strength. With the upper band at 502.70 and %B at 98%, price is hugging the top of the envelope. That usually means the market is trading near the most extended part of its recent statistical range. The band width has expanded to 40.5%, showing volatility is high and the move has room to continue — but also room to reverse quickly if momentum cools.
Oscillators & Momentum
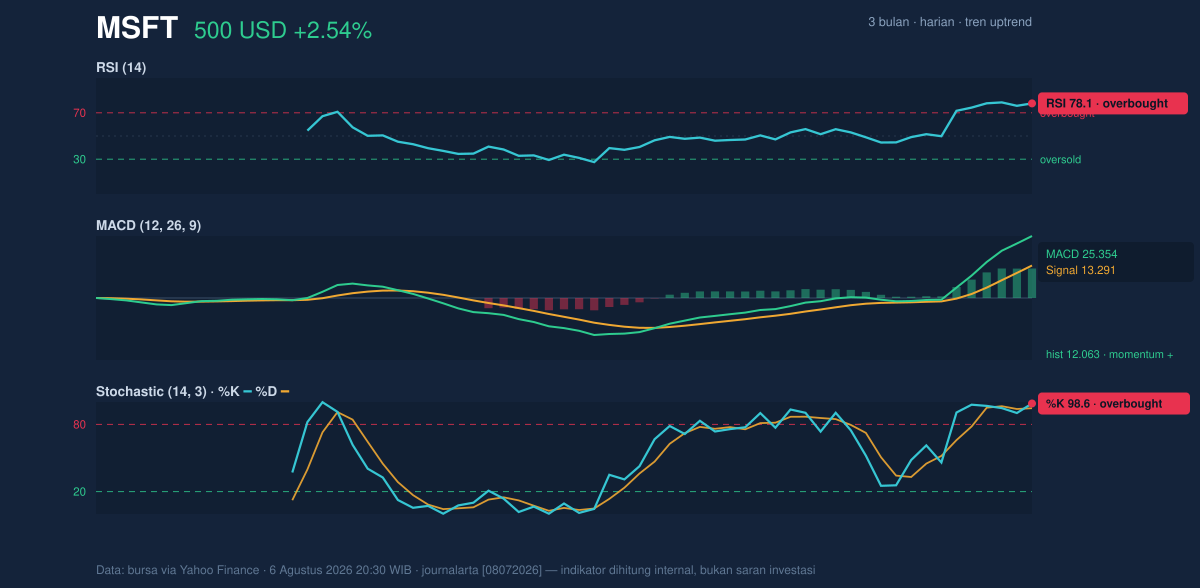
Momentum indicators are aligned, but they are also warning that the stock may be overcooked in the short term. RSI at 78.1 is in overbought territory, which does not mean the stock must fall immediately; it means the pace of buying has been strong enough that the chart is stretched. The Stochastic %K at 98.6 and %D at 94.5 tell the same story even more sharply: the stock is closing near the top of its recent range, and fast momentum is running ahead of itself.
That overbought reading matters because it is happening alongside a still-positive MACD of 25.354, above its signal line at 13.291, with a positive histogram of 12.063. MACD is a trend-following indicator, and here it says the bullish trend remains intact. The histogram being positive means upward momentum still exceeds the slower signal trend. So the message is not “trend broken”; it is “trend strong, but extended.” In practical terms, that combination often produces either a brief consolidation or a sharp continuation. Which one appears next depends on whether buyers keep defending the upper band area.
Volatility & Volume
Volatility is elevated. ATR(14) at 18.00, or 3.6% of price, implies that daily swings can be wide enough to shake out weak positions. When ATR rises while the stock sits near the top of its range, it often signals a market capable of large directional moves, but not necessarily in a straight line.
Volume is less emphatic than price. The latest turnover of 36,397,900 is about 0.9× the 20-session average of 39,570,710. That matters because the rally is not being accompanied by an obvious surge in participation. In technical analysis, a strong price move with only average-to-light volume can still be valid, but it suggests the advance is being carried more by price momentum than by a broad burst of new demand. The encouraging counterweight is that OBV is rising, which implies the cumulative volume trend still supports the uptrend even if the latest session was not unusually heavy.
Key Levels & Scenarios
The immediate ceiling is clear: 502.70 from the upper Bollinger Band, with the 3-month high at 501.56 sitting just beneath it. That makes the 499.86 area a live test of whether Microsoft can convert resistance into support. If the stock pushes decisively above that cluster, the chart would be signaling continuation rather than exhaustion.
On the downside, the first meaningful support is the Bollinger middle band at 418.09, which is also SMA20. Below that, the deeper support to watch is 381.58, the 20-hour support level. A failure back through the mid-band would suggest the current extension is unwinding; a break of 381.58 would indicate the short-term structure has weakened materially.
Technical Verdict: HOLD (wait & see)
HOLD (wait & see)
- RSI 78.1 and Stochastic 98.6/94.5 show the stock is overbought, which limits fresh upside without a pause.
- MACD 25.354 above signal 13.291 and the golden cross confirm the uptrend is still intact.
- %B 98% and price near 502.70 show Microsoft is pressing the upper edge of its range, where pullbacks often start.
Verdict invalidated if price falls below 418.09 and loses the Bollinger middle band/SMA20 support.
- Ideal Entry Range: 418.09 to 499.86, with the more conservative end closer to the middle band after a reset.
- Exit Target: 502.70, with 501.56 as the nearby chart hurdle.
- Stop Loss protection: 381.58 as the key short-term support to monitor.
For non-traders: Microsoft’s chart is still strong, but it is running hot enough that the next move could be either a breakout or a breather.
Summary Data MSFT
| Last price | 499.86 USD |
| Change 1 day / 5 days / 1 month | 2.54% / 10.81% / 30.05% |
| Trend / MA-cross | uptrend / golden |
| SMA20 / SMA50 | 418.09 / 405.27 |
| RSI (14) / Stochastic %K | 78.1 / 98.6 |
| Bollinger %B / ATR | 98% / 18.00 |
| Support / Resistance 20 days | 381.58 / 499.86 |
| Data as of | 6 Agustus 2026 20:30 WIB |



