T Stock Gains 2.82% Today, Golden Cross Formed
On Agustus 7, 2026: price 23.71 USD, trend uptrend, RSI 57.5, support 21.13, resistance 24.66. technical analysis of t stock. Stock Gains — full details here.

AT&T traded at 23.71 dollars, up 2.82% on the day and 12.69% over the past month, according to Yahoo Finance data cited after the Aug. 6, 2026 close. The move matters because it is not just a bounce off recent weakness: the shares are now sitting above their short-term trend line, with a technical structure that has shifted from defensive to constructive, even if participation has not fully caught up.
Trend & Price Action
The first signal is the simplest one. Price is trading above both the SMA20 at 22.84 and the SMA50 at 22.71, and the chart shows a golden cross, meaning the faster 20-day average has moved above the slower 50-day average. In plain terms, that usually tells traders that the recent pace of buying has improved enough to overtake the longer baseline trend.
That does not guarantee a straight line higher. But it does mean the stock is no longer fighting its own trend. The uptrend is reinforced by the 2.83% five-day slope of the SMA20, which suggests the short-term trend is still rising rather than flattening out. The shares are also positioned at roughly 73% of the 20-hour range, leaving them closer to resistance than support, as shown in the chart.
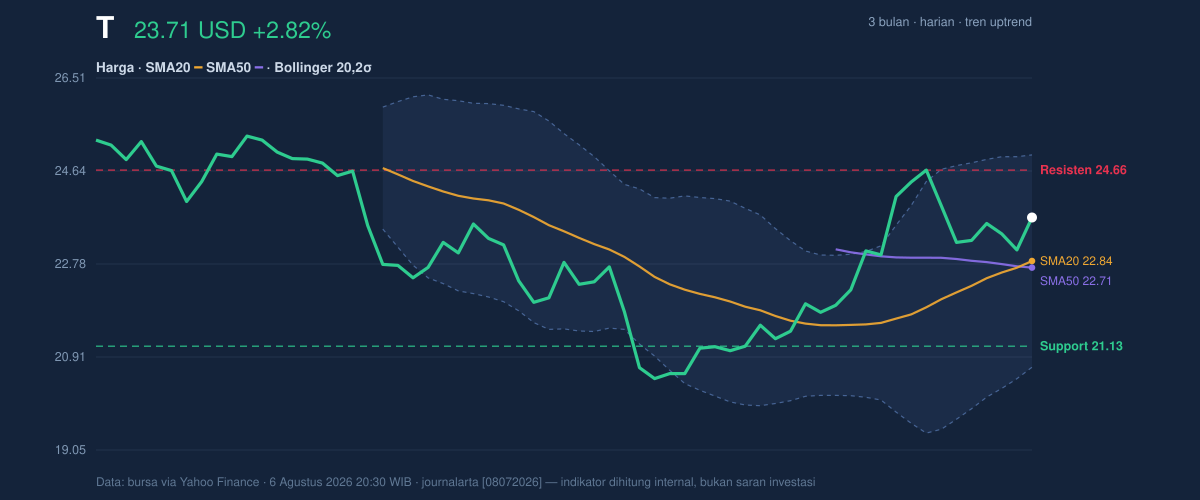
The wider backdrop adds context. AT&T is trading below the 3-month high of 25.55 but well above the 3-month low of 19.89, which places it in the upper half of its recent range without yet testing the ceiling. That is often the zone where markets decide whether the move is a trend continuation or just a relief rally.
Oscillators & Momentum
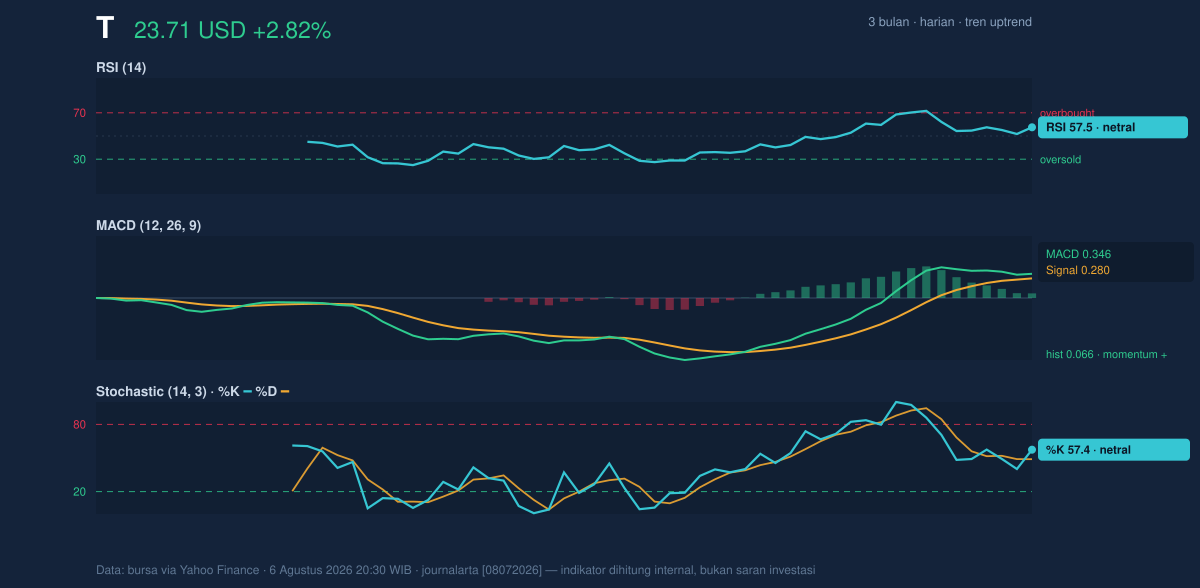
Momentum is positive, but not stretched. The RSI at 57.5 is neutral-to-firm, which means the stock has room to extend without immediately flashing overbought conditions. The Stochastic reading of 57.4 versus 48.9 is also neutral, but with a slight upward lean: %K above %D typically suggests near-term buying pressure is still in control, though not aggressively so.
The MACD at 0.346, above its signal line at 0.280, confirms that the trend and momentum are aligned. For non-traders, MACD is a measure of whether recent price action is speeding up or slowing down. Here it says the stock’s upward move still has internal support. The 0.066 histogram is modest, so this is not a breakout signal screaming for attention; it is a steadier message that buyers remain in charge, but only by a margin.
That distinction matters. A stock with rising price and a positive MACD but neutral RSI often has a healthier profile than one already overheated. It suggests the move is being built, not chased.
Volatility & Volume
The Bollinger Band setup supports that reading. Price is near the middle-upper portion of the band structure, with %B at 71%. That means AT&T is trading above the band midpoint and closer to the upper band at 24.96 than the lower band at 20.71, but not at an extreme. The 18.6% band width is described as normal, which implies volatility is not compressed into a breakout coil and not exploding into disorder either.
The ATR of 0.78, equal to 3.3% of price, points to moderate day-to-day movement. That is enough room for swings, but not enough to suggest a highly unstable tape. The volume picture is more nuanced. Last volume came in at 47,679,200, below the 20-hour average of 77,425,640, or about 0.6x normal. In other words, the price advance happened without heavy turnover. That can mean two things: either sellers were absent, or buyers have not yet committed in force.
The OBV is rising, which softens that concern. OBV, or on-balance volume, tracks whether volume is flowing into up days or down days. A rising OBV while price advances suggests accumulation is still present underneath the surface, even if the latest session did not come with a flood of trading.
Key Levels & Scenarios
The chart’s key markers are clear. Support at 21.13 is the first line that matters if the stock loses momentum. Below that, the broader trend would start to look less comfortable because the price would be moving back toward the lower half of the recent range. On the upside, resistance at 24.66 is the immediate test. That level sits just below the upper Bollinger band at 24.96, so the stock is approaching a zone where short-term traders often take profits or wait for confirmation.
If AT&T clears 24.66 with improving volume, the next technical message would be that the recent advance is escaping the current range rather than merely probing it. If it fails there, the shares could drift back toward the SMA20 at 22.84, which now acts as a pivot rather than just a moving average.
Technical Verdict: HOLD (wait & see)
- Reason 1: Golden cross and price above the SMA20/SMA50 show the trend has improved.
- Reason 2: MACD is positive and the RSI at 57.5 is healthy, suggesting momentum is constructive but not overheated.
- Reason 3: Volume is only 0.6x normal, so the move lacks strong participation even though OBV is rising.
- Invalidation: the verdict is invalidated if price falls below 21.13.
- Ideal entry range: 22.84 to 23.71
- Exit target: 24.66 to 24.96
- Stop loss protection: below 21.13
For readers not using charts, this means the stock is technically healthier than it was a few weeks ago, but it has not yet proved that the latest rise is backed by enough trading conviction to force a clean breakout.
“It has momentum, but it still needs proof.”
Summary Data T
| Last price | 23.71 USD |
| Change 1 day / 5 days / 1 month | 2.82% / 2.15% / 12.69% |
| Trend / MA-cross | uptrend / golden |
| SMA20 / SMA50 | 22.84 / 22.71 |
| RSI (14) / Stochastic %K | 57.5 / 57.4 |
| Bollinger %B / ATR | 71% / 0.78 |
| Support / Resistance 20 days | 21.13 / 24.66 |
| Data as of | 6 Agustus 2026 20:30 WIB |



