Walt Disney Co. rose to 104.68 USD on 6 August 2026, up 2.87% on the day and 8.86% over five days, with the stock now sitting at the very top of its short-term range, according to data from Yahoo Finance via the exchange feed. That move matters because it is not just a rebound in price; it is a test of whether buyers can keep pushing a stock that is already trading above SMA20 at 97.36 and above SMA50 at 98.93, while momentum indicators begin to look stretched. In plain terms, Disney is advancing, but the market is also asking how much of that move is already priced in.
Trend & Price Action
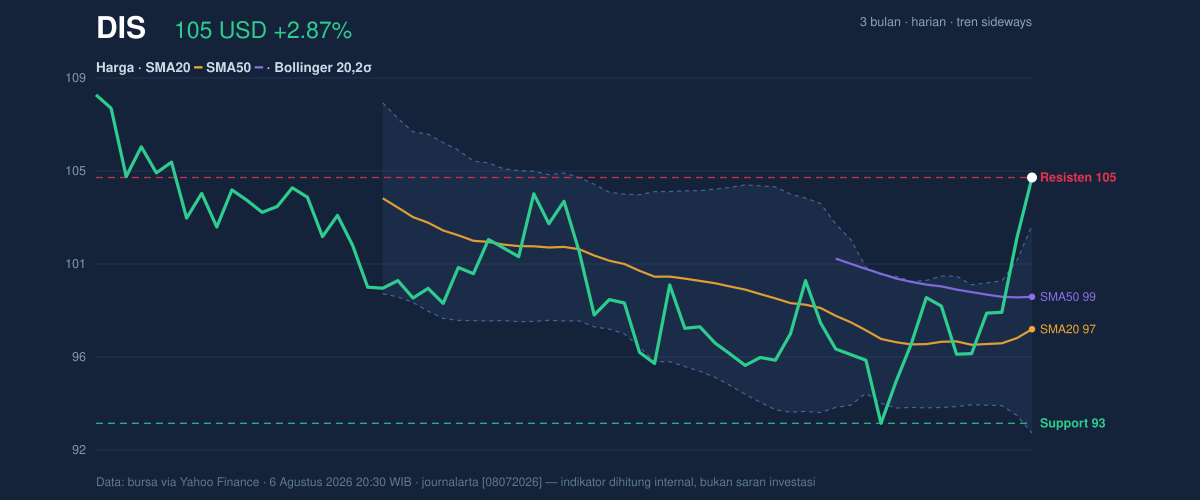
Disney’s broader setup is best described as sideways, even after the recent lift. The SMA20 slope of 0.60% over five days shows the short-term trend has turned upward, but not forcefully enough to label the move as a new directional breakout. The stock is also trading above both the SMA20 and SMA50, which is constructive because it signals that recent prices are holding above the average levels traders watch for trend confirmation. Still, the note that there is no new MA-cross means this is not a fresh long-term trend change; it is more a continuation of recovery than a decisive regime shift.
3-month price action chart of DIS: price, SMA20/50, Bollinger, support & resistance. Data: exchange via Yahoo Finance.
The price is also sitting at 100% of its 20-day range, with support at 92.83 and resistance at 104.68. That positioning is important: when a stock is at the top of its recent band, the market is no longer debating whether it can recover, but whether it can absorb profit-taking without slipping back into the middle of the range. The three-month high of 110.48 is the next obvious reference point, while the three-month low of 92.49 helps frame how far the rebound has already traveled. The short version: Disney is near the upper edge of its recent trading box, and that usually makes the next move more sensitive to news and volume.
Oscillators & Momentum
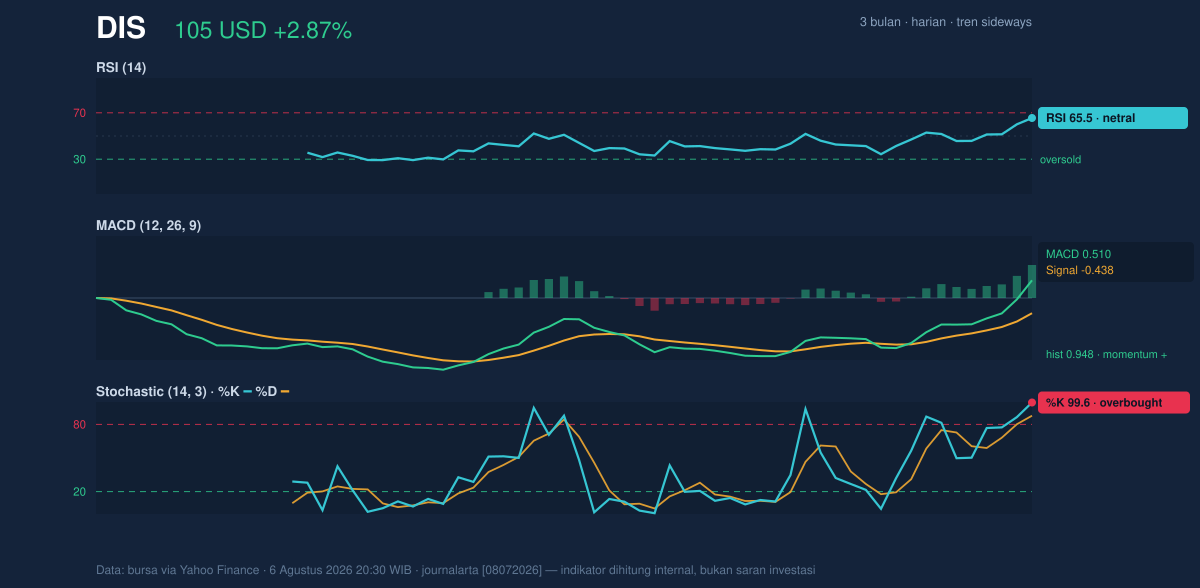
The momentum picture is mixed, and that mix is the story. The RSI at 65.5 is still technically neutral, which suggests the stock is not yet in a fully overheated condition. But the Stochastic %K at 99.6 and %D at 87.8 are clearly overbought, meaning the latest push has been fast enough that near-term buyers may already be crowded in. That does not automatically mean the stock must fall; it means the pace of gains has become harder to sustain without a pause or consolidation. The MACD at 0.510 above its signal line at -0.438, with a histogram of 0.948, keeps the momentum bias positive. In practical terms, MACD says the trend is still improving, while Stochastic warns that the move may be getting ahead of itself.
Momentum chart of DIS: RSI(14), MACD, Stochastic. Data: exchange via Yahoo Finance.
This is the classic tension in a late-stage advance: trend-following tools are supportive, but short-term oscillators are flashing caution. When those signals diverge, the market often pauses rather than reverses outright. The pause is the signal.
Volatility & Volume
The Bollinger Band setup reinforces that message. Disney is trading above the upper band at 102.37, with %B at 123%, which means price has extended beyond the normal envelope of recent trading. The band width of 10.3% is described as normal, so this is not a volatility squeeze waiting to explode; instead, it is an extension move occurring in an average volatility environment. That matters because breakouts from a squeeze often carry more fuel, while extension moves can be more vulnerable to mean reversion if momentum cools.
Volume helps confirm that the advance is not happening in a vacuum. Last volume was 14,041,100, versus a 20-day average of 11,937,910, or 1.2 times normal. That is not a huge surge, but it is enough to show real participation behind the move. The rising OBV, or on-balance volume, adds a second layer of confirmation: more volume is flowing in the direction of the price trend than out of it. In simple language, buyers are showing up, but not yet in a panic-buying wave.
Key Levels & Scenarios
The immediate battleground is clear. 104.68 is both the latest close and the current resistance marker, so holding above it would be a sign that Disney is trying to convert a ceiling into a floor. If that fails, the first area to watch is 102.37, the upper Bollinger Band, followed by the 97.36 area around SMA20 and the Bollinger middle band. A deeper pullback would put attention on 92.83, the 20-day support level, which also sits close to the 92.49 three-month low.
The signal is straightforward: strength is intact, but it is stretched. The stock has room to keep moving if buyers can defend the breakout zone, yet the overbought Stochastic and the price position above the upper Bollinger Band argue for caution if momentum fades.
Technical Verdict: HOLD (wait & see)
HOLD (wait & see)
- MACD is positive and still supports the upward bias.
- Price is above SMA20 and SMA50, which keeps the trend constructive.
- Stochastic is overbought and %B is 123%, suggesting the move is extended and vulnerable to a pause.
Verdict invalidated if price falls below 92.83.
- Ideal Entry Range: 97.36 to 102.37
- Exit Target: 110.48
- Stop Loss protection: 92.83
For non-traders: Disney looks healthy, but after a fast climb, the stock may need to cool off before the next clear move.
“We’re seeing strength, but it’s the kind of strength that can make investors hold their breath.”