TMUS Stock Technicals Today: Gains 3.75%, Momentum Weakens
On Agustus 7, 2026: price 179.97 USD, trend sideways, RSI 49.0, support 170.42, resistance 195.64. technical analysis of tmus stock. TMUS Stock Technicals —…

For international investors watching U.S. telecom, T-Mobile US is trading in a narrow, indecisive band even after a sharp one-day rebound, and the chart still says the market has not yet chosen a direction.
T-Mobile US (TMUS) finished at 179.97 USD on Nasdaq, up 3.75% from the previous close of 173.46, according to exchange-linked market data cited by Yahoo Finance. That bounce matters, but it does not erase the bigger message in the chart: the shares are still sitting below the 20-day SMA at 182.94 and below the 50-day SMA at 182.46, which means the latest move has not yet reclaimed the short-term trend line. In plain terms, buyers showed up, but they have not yet forced a clean trend reversal.
Trend & Price Action
As shown in the chart, TMUS remains in a sideways trend, and the SMA20 slope of -0.68% over five days suggests the recent drift has been mildly downward rather than decisively bullish. The lack of a fresh MA-cross reinforces that message: there is no new moving-average signal confirming a trend change. When a stock trades just under both the 20-day and 50-day averages, it often signals a market that is still testing whether the rebound is real or just a pause in weakness.
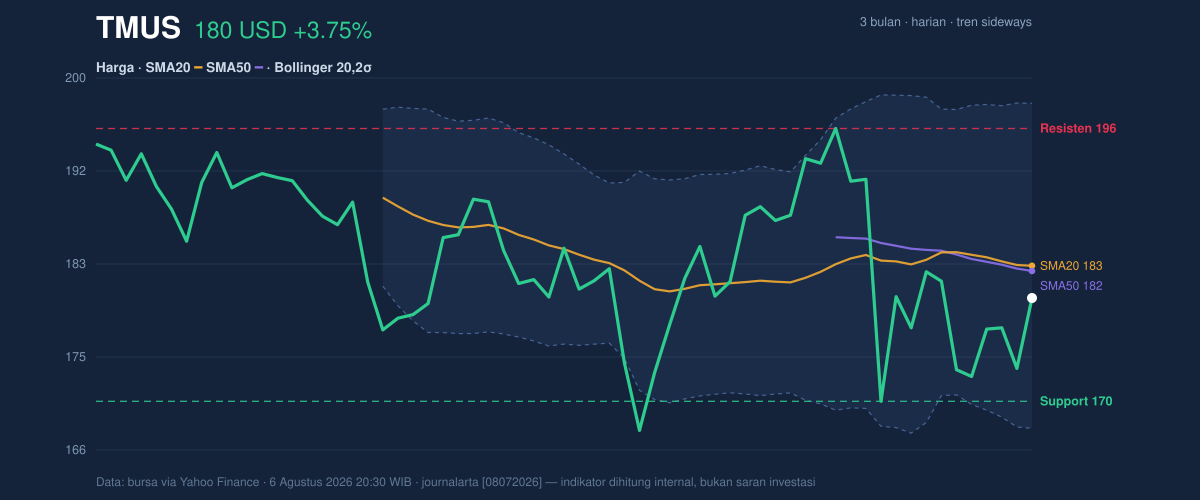
The price is also positioned at about 38% of the 20-hour range, with support at 170.42 and resistance at 195.64. That placement is important because it shows TMUS is not pressing the upper half of the range where momentum usually strengthens. Instead, it is still closer to the lower-middle portion, leaving room for either a recovery toward resistance or a pullback toward support. The broader three-month range, 198.86 high and 165.66 low, shows the stock has been contained inside a relatively defined corridor, which is typical of a mature large-cap telecom name when investors are waiting for a clearer catalyst.
Oscillators & Momentum
The momentum gauges are mixed rather than supportive. The RSI at 49.0 is neutral, which means the stock is neither stretched upward nor washed out. That is a sign of balance, not conviction. The Stochastic %K at 39.0 and %D at 25.9 also sit in neutral territory, but the gap between the two suggests short-term momentum has improved from weaker levels without yet becoming strong enough to confirm a sustained upswing.
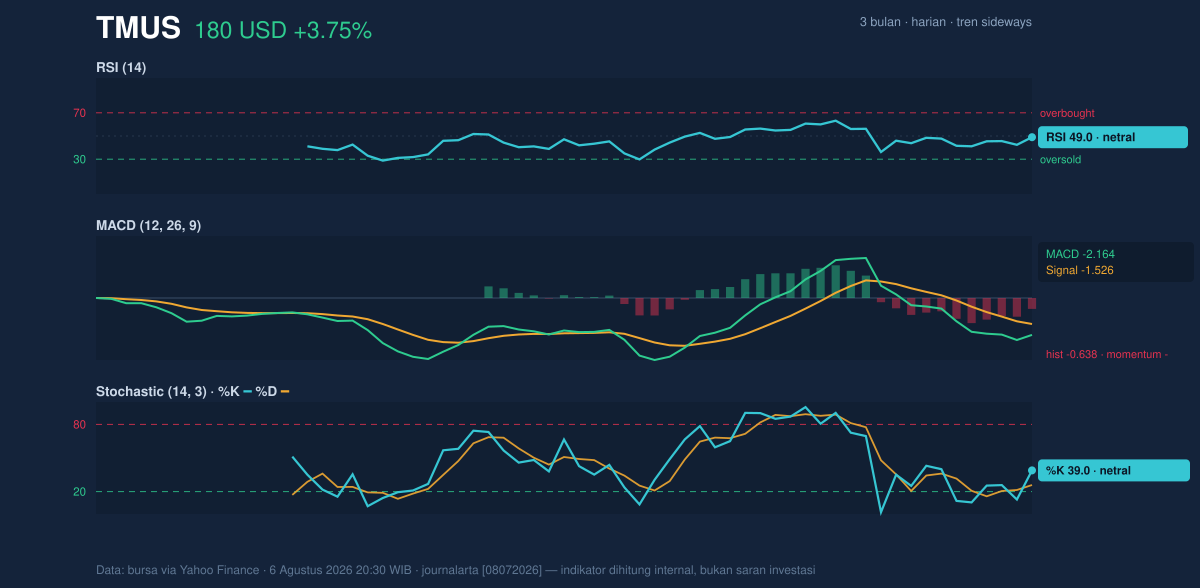
The more cautionary signal comes from the MACD at -2.164, below its signal line at -1.526, with a histogram of -0.638. In practical terms, MACD is still pointing to negative momentum: the stock may have bounced, but the underlying trend pressure has not fully turned positive. That kind of setup often appears when a rebound is running ahead of confirmation. It is not a bearish breakdown by itself, but it does warn that enthusiasm is not yet backed by trend momentum.
Volatility & Volume
Volatility is not subdued. The ATR(14) at 7.74, equal to 4.3% of price, indicates the stock can still move meaningfully in either direction over a short period. The Bollinger Bands add a useful frame: the upper band is 197.96, the middle band is 182.94, and the lower band is 167.92, with %B at 40% and band width at 16.4%, described as normal. That combination suggests TMUS is not in a squeeze that usually precedes a sharp breakout, nor is it already extended. It is more of a waiting pattern, with price sitting below the mid-band and therefore lacking the momentum confirmation that would come from reclaiming the center line.
Volume also argues for caution. Last session volume was 4,439,800, below the 20-day average of 5,046,850, or about 0.9x normal. A rebound on lighter participation is less persuasive than one backed by heavier trading. The OBV is down, which means cumulative volume flow has been weakening rather than improving. That matters because price can bounce on headlines or short covering, but a durable move usually needs participation to turn first.
Key Levels & Scenarios
The most important level on the downside is still 170.42 support. If TMUS loses that area, the chart would be telling investors that the recent bounce failed to hold the lower boundary of the range, and the stock could revisit the broader 165.66 three-month low zone. On the upside, 182.94 and 182.46 are the first hurdles because they combine the 20-day and 50-day averages. A move through that pocket would matter more than a one-day rally because it would show the market has reclaimed the short-term trend framework. Above that, 195.64 resistance is the next major barrier before the 197.96 Bollinger upper band and the 198.86 three-month high.
The signal is therefore conditional: if TMUS can reclaim the moving-average zone with stronger volume, the chart would begin to shift from neutral-to-weak toward constructive. If it cannot, the current bounce risks fading back into the range.
Technical Verdict: HOLD (wait & see)
HOLD (wait & see)
- RSI 49.0 and Stochastic 39.0 / 25.9 are neutral, so momentum is not strong enough to confirm a trend change.
- MACD -2.164 below signal -1.526 keeps the underlying momentum negative despite the day’s rebound.
- Price below SMA20 182.94 and SMA50 182.46, with OBV down and volume at 0.9x normal, says participation has not yet validated the move.
- Verdict invalidated if price breaks below 170.42, because that would weaken the current range floor and expose the lower end of the recent trading band.
- Ideal Entry Range: 182.46 to 182.94, only if price reclaims both moving averages and holds above them.
- Exit Target (Target Price): 195.64, with the 197.96 Bollinger upper band as the next technical reference.
- Stop Loss protection: 170.42, the nearest support level that defines the current range.
For non-traders: the chart says T-Mobile has bounced, but it has not yet proved that the rebound is strong enough to become a new trend.
“Until the stock can hold above its moving averages, the market is still asking the same question: was that strength, or just a pause?”
Summary Data TMUS
| Last price | 179.97 USD |
| Change 1 day / 5 days / 1 month | 3.75% / 3.82% / -0.83% |
| Trend / MA-cross | sideways / none |
| SMA20 / SMA50 | 182.94 / 182.46 |
| RSI (14) / Stochastic %K | 49.0 / 39.0 |
| Bollinger %B / ATR | 40% / 7.74 |
| Support / Resistance 20 days | 170.42 / 195.64 |
| Data as of | 6 Agustus 2026 20:30 WIB |



