AIA Testing Key Resistance: Stock Drops 0.52% (September 8, 2026)
On September 8, 2026: price 77.10 HKD, trend sideways, RSI 59.0, support 70.40, resistance 77.50. technical analysis of aia stock. AIA Testing Key Resistance —…

AIA Group ended at 77.10 HKD, down 0.52% on the day, but the bigger signal is that the shares are still holding above both the SMA20 at 74.44 and the SMA50 at 75.07. That places the stock in a constructive short-term position, even as it trades just below the recent 77.50 ceiling and near the top of its 20-day range. As shown in the chart, the price is not in a breakout phase yet, but it is also not showing the kind of weakness that usually marks a failed rally.
Trend & Price Action
The chart shows a market that is still moving sideways, but with a slight upward lean. The SMA20 is rising at 0.42% over five days, which matters because a flat or falling short-term average would suggest momentum is fading. Here, the average is edging higher while price stays above it, a sign that buyers have not lost control of the near-term structure.
What makes this setup more interesting is the position within the recent range. The stock is sitting at 94% of the 20-day range, which tells readers the price is pressing toward the upper end rather than lingering in the middle. That usually signals strength, but it also means upside room is narrower unless volume improves. The lack of a fresh MA-cross is important too: there is no new moving-average trigger forcing a trend change, so the market is being driven more by gradual accumulation than by a sharp technical shift.
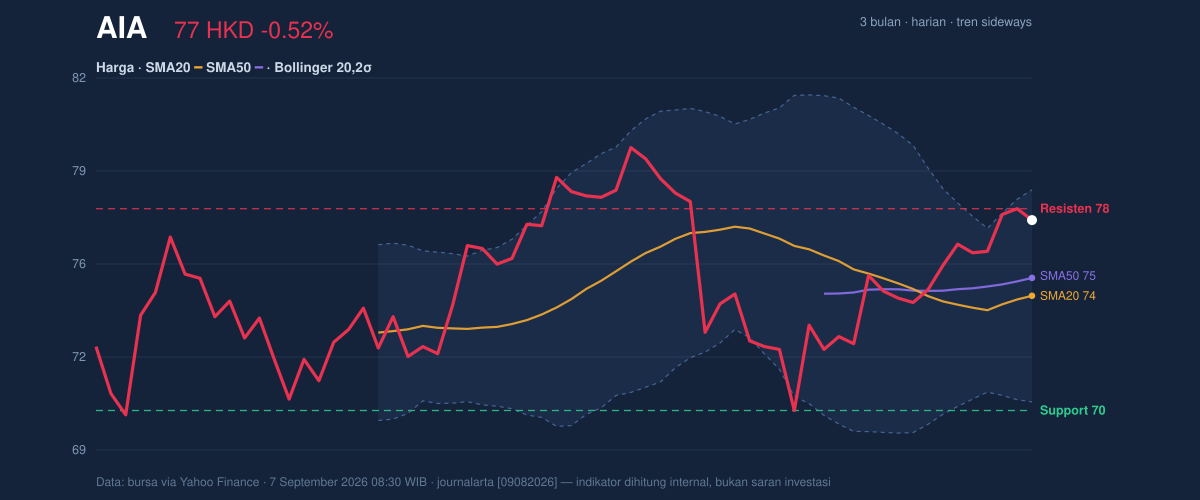
The broader context is still supportive. AIA is above the 3-month low of 69.05 and below the 3-month high of 80.15, which leaves the stock in the upper half of its recent trading band. That positioning often indicates a market that is recovering or consolidating gains rather than one that is under pressure.
Oscillators & Momentum
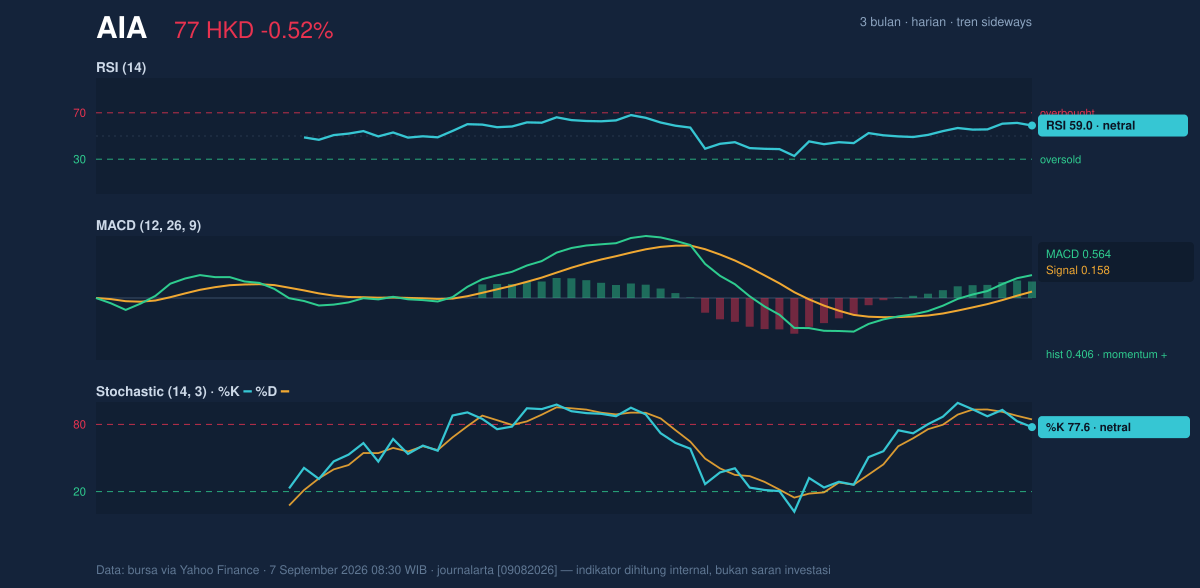
Momentum is positive, but not stretched enough to call the move overheated. The RSI at 59.0 sits in neutral territory, which means the stock has room to extend without immediately entering overbought conditions. That is a healthier reading than an RSI above 70, where rallies often become vulnerable to quick pullbacks.
The Stochastic %K at 77.6 and %D at 84.5 are both elevated, which shows the stock has been trading near the upper end of its recent range. For general readers, Stochastic is a short-term gauge of whether price is closing near the top or bottom of its recent band. Here, it says the stock is strong, but also close enough to the upper boundary that some cooling would not be surprising.
The more important confirmation comes from MACD at 0.564 versus its signal line at 0.158, with a histogram of 0.406. That combination means upward momentum is still ahead of its trigger line. In plain terms, the trend is not just stable; it still has positive internal force. As shown in the momentum chart, this is the clearest bullish element in the data.
Volatility & Volume
Volatility is present, but not excessive. The ATR at 1.72, equal to 2.2% of price, suggests normal day-to-day movement rather than a disorderly swing environment. That matters because a stock can sit near resistance and still be tradable if volatility is contained; here, the market appears orderly enough for a measured move rather than a violent breakout.
The Bollinger Bands add a useful nuance. Price is near the upper band, with %B at 86%, while the band width is 10.0%, described as normal. That signals pressure toward the top of the range, but not a volatility squeeze that would often precede a sudden expansion. In other words, the stock is leaning bullish, yet the band structure does not indicate an imminent explosive move by itself.
Volume is the main caution flag. The latest turnover of 12,567,649 was only 0.4× the 20-day average of 29,181,939, meaning participation was quiet. Low volume near resistance can be a warning that the move lacks conviction. At the same time, OBV is rising, which suggests the broader accumulation trend is still improving even if the latest session was thin. That divergence is subtle but important: the market may be building rather than rushing.
Key Levels & Scenarios
The immediate battlefield is clear. Resistance sits at 77.50, which is also the latest short-term ceiling. A clean hold above that level would improve the case for a continuation toward the upper Bollinger band at 78.17, and then toward the 3-month high at 80.15. Failure to clear 77.50, especially on weak volume, would reinforce the idea that the stock is still range-bound.
On the downside, support is 70.40. That is the level that matters if momentum fades or if the recent advance loses traction. The SMA20 at 74.44 and SMA50 at 75.07 now act as intermediate cushions, so a move back below those averages would weaken the current constructive tone before support is even tested.
Technical Verdict: HOLD (wait & see)
HOLD (wait & see)
- MACD remains positive, showing momentum is still constructive.
- Price is above SMA20 and SMA50, which keeps the short-term trend intact.
- Volume was only 0.4× average, so the latest move lacks strong participation near resistance.
Verdict invalidated if price falls below 70.40.
- Ideal Entry Range: 74.44 to 75.07, where the SMA20 and SMA50 sit.
- Exit Target: 78.17, with 80.15 as the next technical marker if resistance gives way.
- Stop Loss protection: 70.40, the 20-day support level.
For non-traders, this means the stock is technically firm, but it has not yet proved that it can break out cleanly above resistance.
Summary Data AIA
| Last price | 77.10 HKD |
| Change 1 day / 5 days / 1 month | -0.52% / 1.11% / 3.49% |
| Trend / MA-cross | sideways / none |
| SMA20 / SMA50 | 74.44 / 75.07 |
| RSI (14) / Stochastic %K | 59.0 / 77.6 |
| Bollinger %B / ATR | 86% / 1.72 |
| Support / Resistance 20 days | 70.40 / 77.50 |
| Data as of | 7 September 2026 08:30 WIB |


