DBS Stock Technicals Today: Drops 0.23%, Testing Key Resistance
On September 8, 2026: price 78.47 SGD, trend uptrend, RSI 66.7, support 75.53, resistance 78.65. technical analysis of dbs stock. DBS Stock Technicals — full…

DBS Group’s shares were trading at SGD 78.47 on SGX at 08:00 WIB on 7 September 2026, just below the session’s SGD 78.65 close reference and within striking distance of the SGD 79.05 three-month high. The stock is still in an uptrend, but the latest readout is less about speed and more about compression: price is pressing the upper edge of its Bollinger band while volume has slowed, a combination that often signals a market waiting for a catalyst rather than one already in full acceleration.
Trend & Price Action
DBS remains above both its SMA20 at SGD 76.61 and SMA50 at SGD 73.58, which keeps the broader structure constructive. That matters because moving averages are not just lines on a chart: they help show whether buyers are still willing to pay up over multiple time frames. With price above both averages and the SMA20 still rising at 1.03% over 5 days, the short-term trend is intact. There is no fresh MA-cross, so the message is continuity rather than a new trend signal.
The more telling feature is where price sits inside the recent range. DBS is trading near the top of its 20-hour support-resistance band from SGD 75.53 to SGD 78.65, at roughly 94% of that range. That means the market has already done most of the work required to reach the current ceiling.
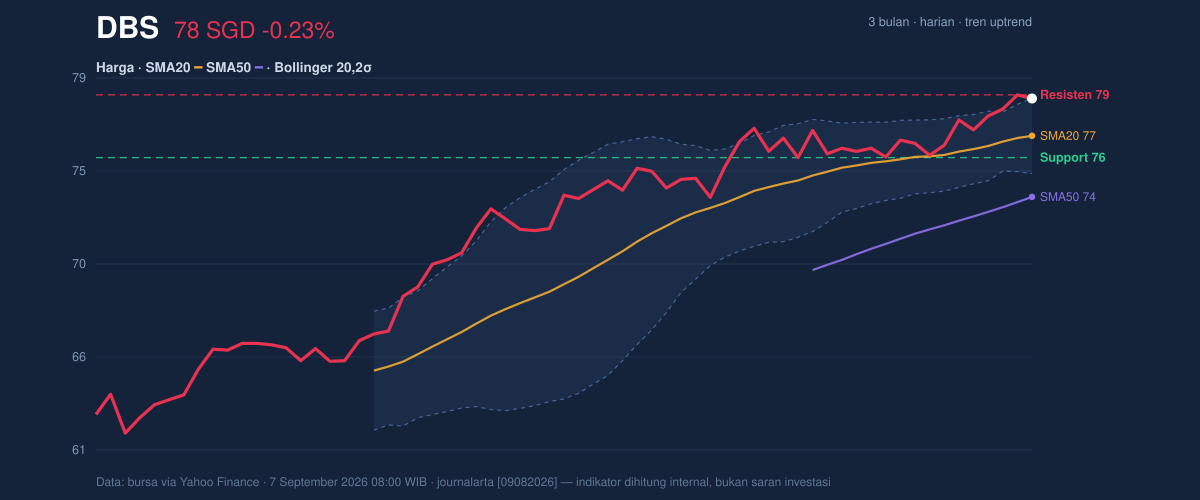
The chart shows a stock that is still rising, but now testing the upper boundary of its recent channel.
The Bollinger setup sharpens that reading. Price is near the upper band at SGD 78.49, with %B at 99%, which means the share price is almost fully stretched to the top of the band. In plain language, the market is trading at the high end of its recent volatility envelope. That often signals strength, but it also leaves less room for error if momentum cools.
Just as important, the Bollinger bands are narrowing to 4.9%, a squeeze that usually reflects compressed volatility and the possibility of a sharper move once the market chooses a direction.
Oscillators & Momentum
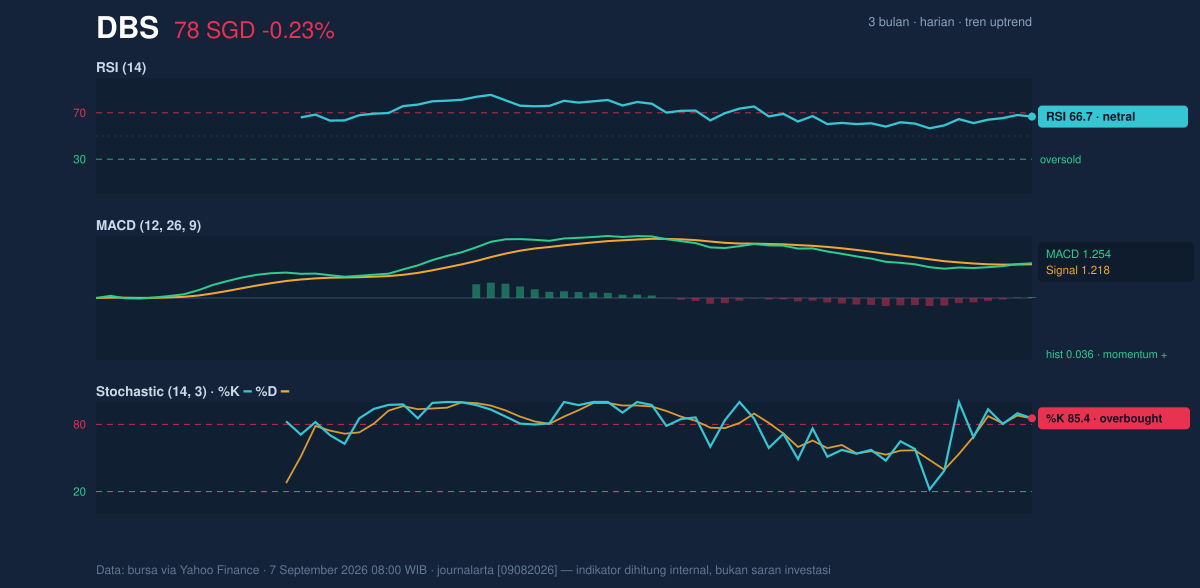
Momentum is mixed in a way that deserves attention. The RSI at 66.7 is still technically neutral, but it is edging close to the overbought zone. RSI measures the speed of recent gains versus losses; at this level, it says buyers remain in control, though enthusiasm is no longer early-stage.
The Stochastic reading of 85.4 / 85.3 is more stretched. Stochastic is a faster oscillator, so it often reaches extremes before RSI does. Here, it is already in overbought territory, which does not automatically mean reversal, but it does mean the stock may need either a pause or a fresh burst of demand to keep climbing without friction.
The MACD at 1.254 above its signal line at 1.218, with a positive histogram of 0.036, still confirms upward momentum. MACD is useful because it captures trend direction and the pace of change; the positive spread says the trend has not broken. The nuance is that the gap is modest, so the momentum advantage exists, but it is not especially wide.
In short: the oscillators are not contradicting the trend, but they are warning that the move is mature.
Volatility & Volume
The volatility backdrop is subdued. ATR at 0.97, or 1.2% of price, points to relatively low daily movement. ATR, or average true range, is a gauge of how much a stock typically moves; a low reading means the market is not swinging violently. That fits the Bollinger squeeze and suggests traders may be waiting for a trigger before committing more aggressively.
Volume, however, is softer than usual. The latest print of 2,489,800 shares is only 0.6x the 20-hour average of 3,961,890. Thin volume at the top of a range can be a warning sign if price tries to extend higher without broader participation. Still, OBV is rising, which means cumulative volume flow has been supportive over time. That is an important counterweight: even if the latest session was quieter, the underlying flow has not turned negative.
This is a market that has not lost sponsorship, but it is no longer surging on heavy conviction.
Key Levels & Scenarios
The immediate technical map is clear. SGD 78.65 is the nearest resistance and also the key level being tested. A clean move through that zone, especially if accompanied by stronger volume, would leave the stock facing the three-month high at SGD 79.05. Above that, the chart would be entering fresh territory within the recent range.
On the downside, SGD 76.61 — the SMA20 and Bollinger midline — is the first important support. It is the level that separates a healthy pause from a more obvious loss of short-term momentum. Below that, SGD 75.53 is the next support area from the 20-hour range. A failure there would suggest the current squeeze has resolved lower rather than higher.
The setup is therefore balanced but not neutral: trend is positive, momentum is stretched, and volatility is compressed.
Technical Verdict: HOLD (wait & see)
HOLD (wait & see)
- MACD remains positive, so the trend still has upward confirmation.
- Stochastic is overbought and %B at 99% shows price is pressing the upper band, leaving limited short-term room.
- Volume is only 0.6x normal, so the latest push is not yet backed by strong participation.
Verdict invalidated if price breaks SGD 75.53 on a sustained basis, because that would weaken the near-term structure and signal the squeeze has failed downward.
- Ideal entry range: SGD 76.61 to SGD 75.53
- Exit target: SGD 78.65 to SGD 79.05
- Stop loss protection: below SGD 75.53
In plain English: DBS is still technically firm, but the chart looks stretched enough that the next move needs confirmation, not assumption.
“The market is asking for proof, not just momentum.”
Summary Data DBS
| Last price | 78.47 SGD |
| Change 1 day / 5 days / 1 month | -0.23% / 1.38% / 2.80% |
| Trend / MA-cross | uptrend / none |
| SMA20 / SMA50 | 76.61 / 73.58 |
| RSI (14) / Stochastic %K | 66.7 / 85.4 |
| Bollinger %B / ATR | 99% / 0.97 |
| Support / Resistance 20 days | 75.53 / 78.65 |
| Data as of | 7 September 2026 08:00 WIB |


