HSBC Stock Gains 0.98% Today, Testing Key Resistance
On September 8, 2026: price 1,579.00 GBp, trend sideways, RSI 64.8, support 1,497.20, resistance 1,580.20. technical analysis of hsbc stock.

HSBC Holdings (HSBA.L) traded at 1,579.00 GBp on 4 September 2026 at 14:00 WIB, up 0.98% on the day and sitting just below 1,580.20, the top of its 20-hour range. The move leaves the stock close to a three-month high of 1,610.00, but the chart also shows a market that is not yet decisively trending: price is above both SMA20 at 1,527.90 and SMA50 at 1,510.50, while the broader pattern remains sideways. That combination matters because it suggests buyers have regained control in the short term, yet the shares are still working through a range rather than breaking into a clean trend.
Trend & Price Action
As shown in the chart, HSBC is trading above both key moving averages, which is usually a constructive sign because it means recent prices are holding above medium-term and longer-term trend benchmarks. The fact that price is above SMA20 and SMA50 without a new MA-cross tells us the advance is being supported by current momentum, not by a fresh structural shift in trend. The SMA20 slope of -0.13% over 5 days is a subtle warning that the short-term average is still flattening rather than accelerating upward, so the share price is advancing into resistance rather than pulling away from it.
The most important signal in the price structure is proximity to the ceiling: 1,579.00 is essentially at the 1,580.20 resistance and near the upper end of the recent range. That means the market is testing supply, not cruising through it. If the stock can hold above that area, it would strengthen the case that the sideways pattern is resolving upward; if it cannot, the chart remains range-bound.
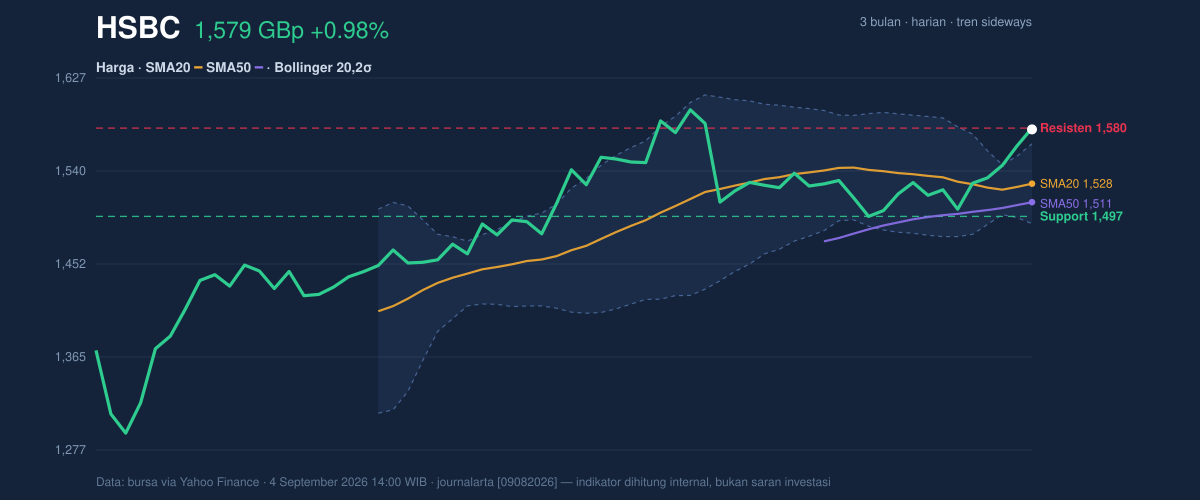
Key point: the shares are near the top of the range, which is encouraging, but not yet proof of a breakout.
Oscillators & Momentum
The momentum picture is more mixed than the price chart. The RSI at 64.8 is still technically neutral, which means the stock is not yet in a stretched condition by that measure. But the Stochastic %K at 98.2 and %D at 94.1 are clearly overbought, indicating the recent rise has been fast enough that short-term traders may already be crowded into the move. In plain language, Stochastic is telling us the stock is closing near the top of its recent trading band almost continuously, which often happens when a rally is mature and vulnerable to pause or consolidation.
That caution is offset by the trend-following side of momentum. The MACD at 10.885, above its signal line at 6.818, with a positive histogram of 4.067, shows that upward momentum is still intact. MACD is useful here because it measures whether the faster trend is outrunning the slower one; in HSBC’s case, it is. So the message from oscillators is not “over and done,” but rather “strong, yet potentially extended.”
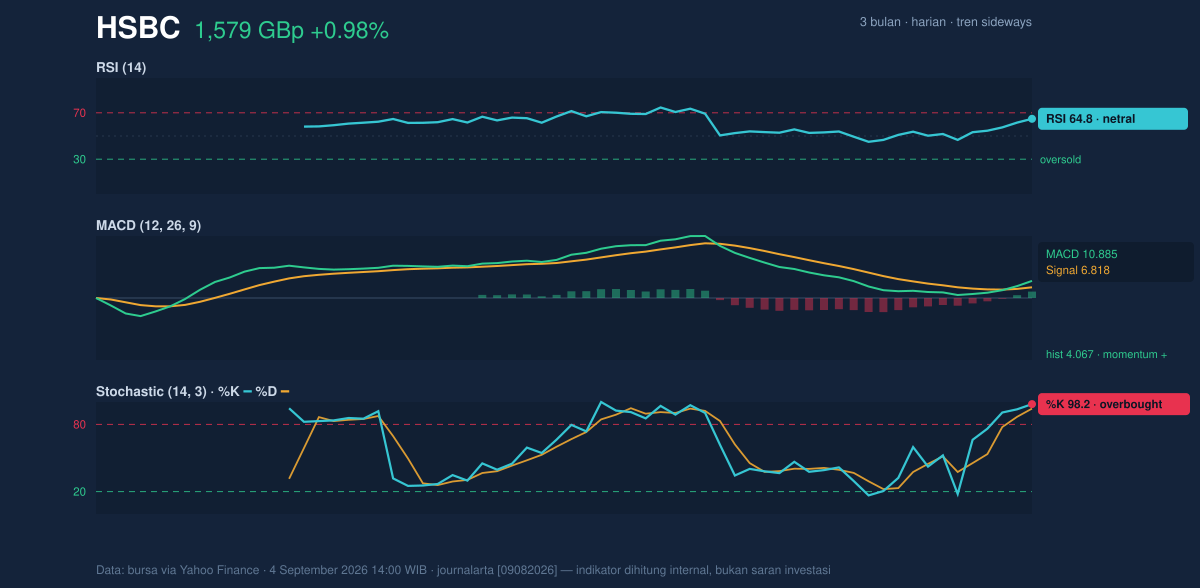
Momentum is positive, but Stochastic is overbought, which often means the stock can keep rising while also becoming more vulnerable to pauses.
Volatility & Volume
The Bollinger Band setup reinforces that tension. The band width is only 4.9%, described as a squeeze, which often signals that volatility has compressed and a larger move may be building. At the same time, %B at 118% shows price is trading above the upper band at 1,565.43. That is a strong technical sign, but it also means the stock is already pushing beyond what the recent volatility envelope would normally contain. When price sits outside the upper band while bands are narrow, traders often interpret it as an early breakout attempt — or a move that may need to cool before it can extend.
Volume does not yet fully confirm the move. Last volume was 15,593,570, below the 20-hour average of 23,958,277, or about 0.7× normal. That matters because a push toward resistance is more convincing when turnover expands. Here, the rise has been accompanied by lighter participation, which suggests the advance may be more orderly than forceful. Still, OBV is rising, and that is an important counterweight: on-balance volume tracks whether money is generally flowing into or out of the stock. A rising OBV implies accumulation is still present underneath the price action, even if the latest session did not bring heavy turnover.
Volatility is compressed, price is extended above the upper Bollinger band, and volume has not yet confirmed aggressively.
Key Levels & Scenarios
The immediate technical map is clear. 1,580.20 is the first resistance to watch, and it is already being tested. Below that, 1,497.20 is the key 20-hour support, a level that also sits close enough to recent action to matter if the stock starts to fade from current highs. The broader 3-month range gives more context: 1,610.00 is the high, while 1,267.20 marks the low, showing that HSBC has already recovered a large portion of its wider trading band.
If the shares can sustain trade above 1,580.20, the chart would shift from range resistance testing toward a cleaner continuation attempt. If it fails there, the market may rotate back toward the 1,527.90 mid-band area and potentially the 1,497.20 support zone. The fact that price is already at 99% of the recent range means there is little room for hesitation before the chart either resolves upward or slips back into consolidation.
Technical Verdict: HOLD (wait & see)
HOLD (wait & see) fits the current setup because the technical picture is constructive but not fully confirmed.
- MACD is positive, showing momentum remains supportive of the recent rise.
- Price is above SMA20 and SMA50, which keeps the short- and medium-term structure constructive.
- Stochastic is overbought and volume is only 0.7× normal, so the move is extended without strong participation.
Verdict invalidated if price falls below 1,497.20, because that would break the nearest support and weaken the current range breakout attempt.
- Ideal Entry Range: 1,527.90 to 1,565.43
- Exit Target (Target Price): 1,580.20 to 1,610.00
- Stop Loss Protection: 1,497.20
In plain English: HSBC is still trending well enough to keep the chart constructive, but it has not yet proved that it can clear resistance cleanly.
HSBC’s three-month high stands at 1,610.00 GBp.
Summary Data HSBC
| Last price | 1,579.00 GBp |
| Change 1 day / 5 days / 1 month | 0.98% / 4.99% / 3.80% |
| Trend / MA-cross | sideways / none |
| SMA20 / SMA50 | 1,527.90 / 1,510.50 |
| RSI (14) / Stochastic %K | 64.8 / 98.2 |
| Bollinger %B / ATR | 118% / 25.77 |
| Support / Resistance 20 days | 1,497.20 / 1,580.20 |
| Data as of | 4 September 2026 14:00 WIB |

