Momentum Weakens, Alibaba Stock Drops 0.45% Today
On September 8, 2026: price 109.60 HKD, trend sideways, RSI 40.4, support 107.50, resistance 126.70. technical analysis of alibaba stock.

Alibaba Group’s Hong Kong-listed shares fell to HKD 109.60 on 9988.HK, slipping 0.45% from the previous close, as the stock continued to trade below both its short- and medium-term trend lines, according to data from Yahoo Finance via the exchange feed. The move leaves the shares in a sideways pattern, but one that is leaning weaker: the price sits under the SMA20 at 117.37 and the SMA50 at 113.91, while the 20-day moving average is still sloping down. In plain terms, that means recent trading has not yet produced the kind of sustained buying pressure needed to reverse the slide.
The chart shows a market that is not collapsing, but is still being pulled lower by its own recent momentum.
Trend & Price Action
As shown in the chart, Alibaba is trading in the lower part of its recent range, at roughly 11% of the 20-hour support-resistance band, with support at 107.50 and resistance at 126.70. That positioning matters because it tells us sellers have already pushed the stock close to the lower boundary of the short-term range, but not yet through it. The broader three-month range of 88.65 to 130.30 shows the stock is still far above the lows, yet well below the highs, which is consistent with a market that has lost upward traction without fully breaking down.
The absence of a fresh MA cross is also important. A “golden cross” or “death cross” is the point where a shorter-term moving average crosses a longer one; no new crossover means the chart has not yet delivered a clean trend signal. Instead, the message is more cautious: the stock is below the averages, and the averages themselves are not turning up.
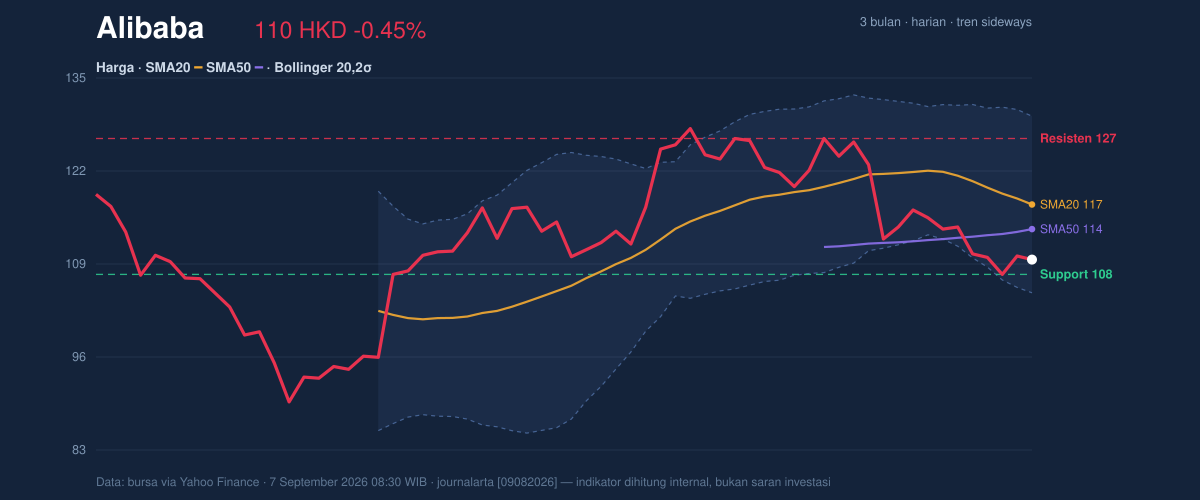
The key price signal is weakness beneath the SMA20 and SMA50, but the stock is still holding above the 107.50 support zone for now.
Oscillators & Momentum
Momentum indicators are mixed, and that mix is what makes this name interesting at current levels. The RSI at 40.4 is neutral, which means the shares are neither clearly overbought nor deeply oversold. By itself, that would suggest indecision. But the Stochastic %K at 13.3 and %D at 11.0 are both in oversold territory, which often signals that short-term selling may be stretched. That does not guarantee a bounce, but it does mean the market is vulnerable to a relief move if sellers lose conviction.
The problem is the MACD at -2.208, with the signal line at -0.764 and the histogram at -1.443. MACD is a trend-following momentum gauge, and a negative reading with a negative histogram means downside momentum is still in control. So while the stochastic oscillator says the stock is close to short-term exhaustion, MACD says the broader near-term trend has not yet turned.
That split matters.
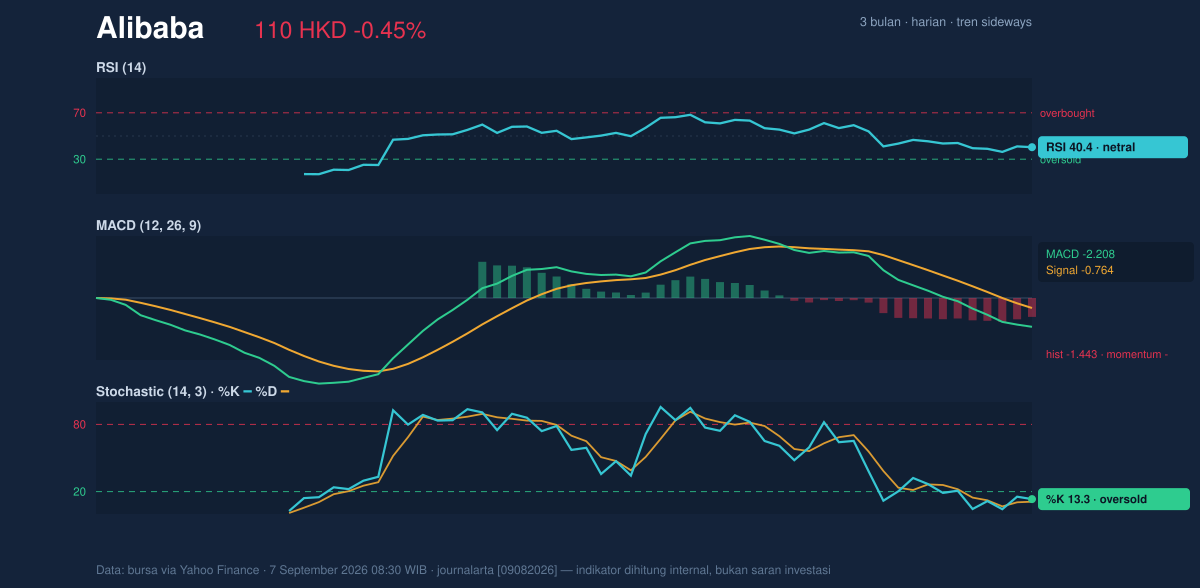
RSI is neutral, Stochastic is oversold, and MACD remains negative — a setup that can produce rebounds, but only if price action starts confirming them.
Volatility & Volume
Volatility is elevated. The Bollinger bands are wide, with the upper band at 129.84, the middle band at 117.37, and the lower band at 104.91. The band width of 21.2% indicates expansion rather than compression, which usually means the market is capable of making larger-than-usual moves in either direction. In other words, the stock is not coiling for a quiet drift; it is already in a more reactive state.
The %B reading of 19% shows the price is sitting near the lower end of the Bollinger structure, close to the lower band. That often reflects weakness, but it also raises the odds of a technical reaction if the lower band and nearby support hold. The ATR at 4.45, equal to 4.1% of price, reinforces that point: daily swings are relatively large, so even a modest move in the chart can cover meaningful ground.
Volume, however, is not confirming a strong capitulation move. Last volume was 40,367,117, well below the 20-day average of 99,166,369, or about 0.4x normal. That suggests the latest decline is happening on quieter participation rather than heavy selling pressure. The OBV is rising, which is a subtle but useful counter-signal: on-balance volume tracks whether volume is accumulating or distributing over time, and a rising line can hint that underlying demand is not as weak as the price alone suggests.
Quiet trading, rising OBV.
That combination often matters more than a single red day.
Key Levels & Scenarios
The immediate technical map is straightforward. 107.50 is the first support to watch, and 104.91 is the lower Bollinger band that sits just beneath it. If the stock holds above that zone, the oversold stochastic reading may help stabilize price and allow for a rebound toward the middle band at 117.37. A move through that level would be the first sign that sellers are losing control.
On the upside, 113.91 is the SMA50 and an early resistance marker, while 126.70 is the more important range resistance. A recovery that cannot reclaim the moving averages would still be considered fragile; a stronger improvement would need to clear those levels with better participation than the latest session showed. If 107.50 fails, the chart would likely shift from range weakness into a more decisive breakdown posture.
Technical Verdict: HOLD (wait & see)
HOLD (wait & see)
- MACD remains negative, so downside momentum is still active.
- Stochastic is oversold, which raises rebound potential, but it is not yet confirmed by price.
- Price is below the SMA20 and SMA50, keeping the short-term trend under pressure.
Verdict invalidated if price breaks 107.50 on a sustained basis.
- Ideal Entry Range: 107.50 to 104.91
- Exit Target: 113.91, then 117.37
- Stop Loss protection: below 104.91
For non-traders: the chart is weak, but not broken yet, and the next move depends on whether support can hold.
Alibaba shares last traded at HKD 109.60.
Summary Data Alibaba
| Last price | 109.60 HKD |
| Change 1 day / 5 days / 1 month | -0.45% / -4.03% / -13.50% |
| Trend / MA-cross | sideways / none |
| SMA20 / SMA50 | 117.37 / 113.91 |
| RSI (14) / Stochastic %K | 40.4 / 13.3 |
| Bollinger %B / ATR | 19% / 4.45 |
| Support / Resistance 20 days | 107.50 / 126.70 |
| Data as of | 7 September 2026 08:30 WIB |


