OCBC Stock Technicals Today: Drops 1.21%, Testing Key Resistance
On September 8, 2026: price 31.88 SGD, trend uptrend, RSI 64.0, support 30.78, resistance 32.27. technical analysis of ocbc stock. OCBC Stock Technicals — full…

OCBC Bank’s shares slipped to 31.88 SGD on SGX, down 1.21% from the previous close of 32.27, even as the broader chart still points to an established uptrend. The move matters less for its size than for its location: the stock is still trading above its short- and medium-term averages, but it has now backed away from the top of its recent range, where momentum has started to look less convincing. As shown in the chart, that combination often signals a market that is still constructive, yet no longer accelerating with the same force.
Trend & Price Action
The structure remains positive. OCBC is above its SMA20 at 31.38 and well above its SMA50 at 29.27, which tells investors the share price is still trading in the upper half of its trend band rather than merely bouncing from a weak base. The uptrend is also backed by a rising SMA20 slope of 2.18% over 5 days, a useful sign that short-term direction is still tilted higher.
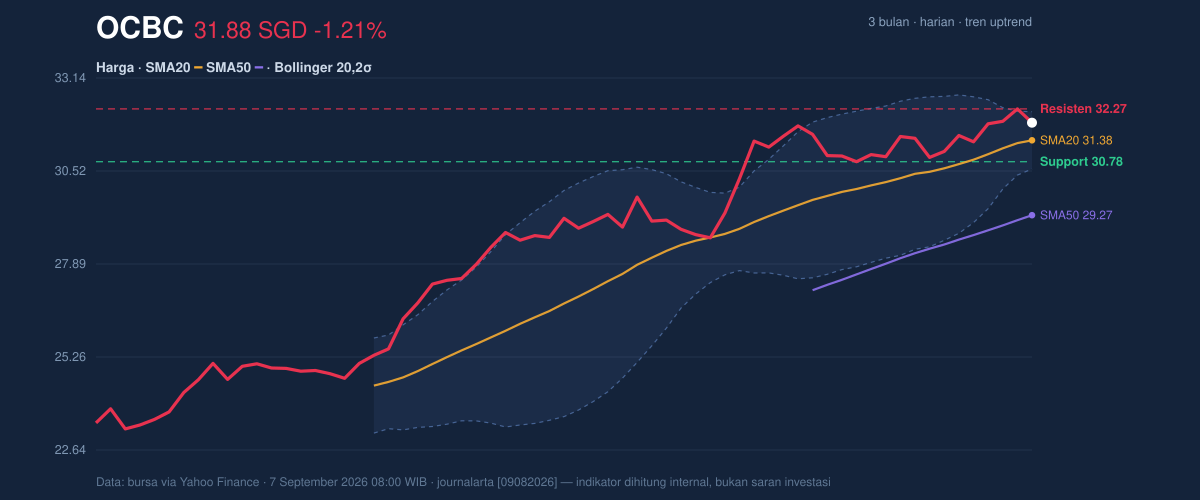
What the latest pullback is saying, however, is that buyers are no longer pressing the stock straight into resistance. The share closed at about 74% of its 20-hour range, which means it is closer to the upper end of that band than the middle, but not at the extreme. That positioning is important because it suggests resilience without euphoria. The 20-hour support at 30.78 and resistance at 32.27 frame the immediate battleground, and the stock is now testing whether recent gains can be defended rather than simply extended.
The broader 3-month range adds context. OCBC is still trading near the upper end of a 32.57 to 23.11 window, which is consistent with a stock that has already done much of the heavy lifting. That does not imply exhaustion on its own, but it does mean fresh upside would likely need renewed participation rather than just passive drift.
Oscillators & Momentum
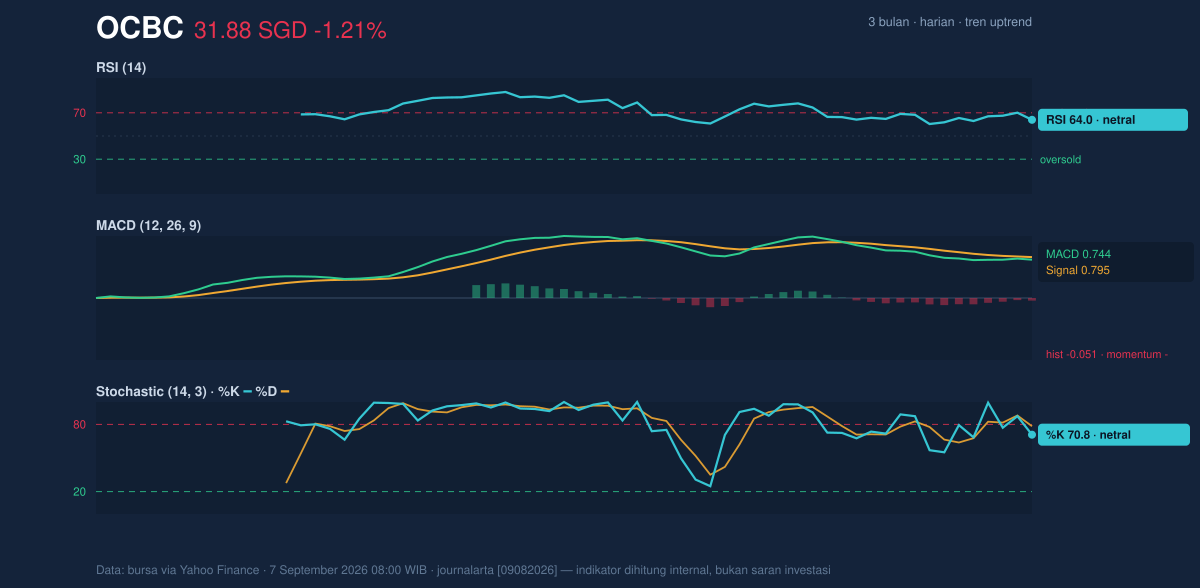
Momentum is mixed, and that is the key message from the oscillator panel. The RSI at 64.0 is still in neutral territory, but it sits high enough to show the stock is not oversold and still has room before it becomes stretched. The Stochastic %K at 70.8 and %D at 78.4 are also neutral, though they are leaning toward the upper side of their range. In plain English, that means the stock has been strong enough to stay elevated, but not strong enough to confirm a fresh breakout with conviction.
The more cautionary signal comes from the MACD at 0.744, which remains below its signal line at 0.795, leaving a histogram of -0.051. MACD is a trend-following measure, and when it turns negative while price is still near highs, it often points to fading upward momentum rather than outright reversal. In other words, the trend is still intact, but the engine is not revving as hard as before.
Volatility & Volume
Volatility is not elevated, but it is not dormant either. The ATR of 0.53, equal to about 1.7% of price, suggests a moderate daily swing environment. That matters because a stock in this state can move decisively once it leaves a narrow range, especially when the Bollinger Bands are compressing.
The Bollinger setup is particularly interesting. Price sits near the upper band, with %B at 81%, while the band width is only 5.2% and is described as a squeeze. A squeeze means volatility has contracted; markets often store energy during these periods before releasing it in one direction. Because OCBC is already above the middle band at 31.38 and close to the upper band at 32.19, the chart is implying a market that is poised for movement, but not yet confirming which side will win.
Volume does not yet confirm a breakout. Last trade volume was 4,868,900, below the 20-day average of 6,236,504, or about 0.8x normal. That is a mild warning sign, because moves through resistance are usually more convincing when accompanied by heavier turnover. Still, the OBV is rising, which suggests underlying accumulation has not disappeared. The message from volume is therefore nuanced: participation is softer on the day, but the broader buying trend has not broken.
Key Levels & Scenarios
The immediate technical map is straightforward. 30.78 is the first support to watch, and it lines up with the lower end of the current short-term range. If that level holds, the chart can keep its constructive bias intact. A move back above 32.27 would put the stock back at resistance and reopen the discussion around a continuation toward the 32.57 3-month high. If instead price slips below 31.38, the SMA20 and Bollinger middle band would be lost together, which would weaken the short-term trend structure and make the squeeze more likely to resolve to the downside first.
The key point is that OCBC is not in a bearish breakdown, but it is no longer in a clean momentum push either. The chart is compressed, the trend is still positive, and momentum is softening at the edge of resistance. That setup often rewards patience more than urgency, because the next directional move may be sharper than the one already seen.
Technical Verdict: HOLD (wait & see)
HOLD (wait & see)
- Price remains above the SMA20 at 31.38 and SMA50 at 29.27, so the broader trend is still constructive.
- MACD is negative versus the signal line, showing momentum is fading even though price has not broken trend support.
- Bollinger Bands are in a squeeze, which often precedes a sharper move, but not yet a confirmed breakout.
- Verdict invalidated if price falls below 30.78, the nearest support and lower edge of the current short-term range.
- Ideal Entry Range: 30.78 to 31.38
- Exit Target: 32.27 to 32.57
- Stop Loss protection: below 30.78
For non-traders, this means the stock still looks healthy, but it needs either a stronger push through resistance or a better pullback to confirm its next move.
The next technical checkpoint is whether OCBC can reclaim 32.27 with volume, or whether the market first tests 30.78 after the latest dip.
Summary Data OCBC
| Last price | 31.88 SGD |
| Change 1 day / 5 days / 1 month | -1.21% / 1.14% / 5.21% |
| Trend / MA-cross | uptrend / none |
| SMA20 / SMA50 | 31.38 / 29.27 |
| RSI (14) / Stochastic %K | 64.0 / 70.8 |
| Bollinger %B / ATR | 81% / 0.53 |
| Support / Resistance 20 days | 30.78 / 32.27 |
| Data as of | 7 September 2026 08:00 WIB |


