Singtel Golden Cross Formed: Stock Gains 0.88% (September 8, 2026)
On September 8, 2026: price 4.56 SGD, trend uptrend, RSI 60.8, support 4.25, resistance 4.56. technical analysis of singtel stock. Singtel Golden Cross Formed…

Singapore Telecom (Singtel) edged up to SGD 4.56 on SGX, gaining 0.88% from the previous close of 4.52, as the stock extended a short-term advance that has already delivered 6.05% over the past month. The move matters less for its size than for its location: the shares are now pressing against the top of the recent trading range, which often tells traders whether a rally is being accepted by the market or merely tested.
Trend & Price Action
The broader technical picture is constructive. Singtel is in an uptrend, with the SMA20 at 4.45 sitting above the SMA50 at 4.43, and the stock itself trading above the SMA20. That alignment is important because it shows short-term price action is not just bouncing, but doing so above a rising near-term average. The golden cross — where the 20-day average moves above the 50-day average — usually signals that momentum has shifted in favor of buyers, or at least that the market is willing to pay progressively higher prices.
The slope of the SMA20, at 0.70% over 5 days, reinforces that message. As shown in the chart, price is sitting near the upper edge of the Bollinger envelope rather than drifting back toward the middle band, which suggests the market is still leaning upward. The stock is also positioned at 100% of its 20-hour range, a sign that it has closed the gap to the nearest technical ceiling rather than stalling mid-range.
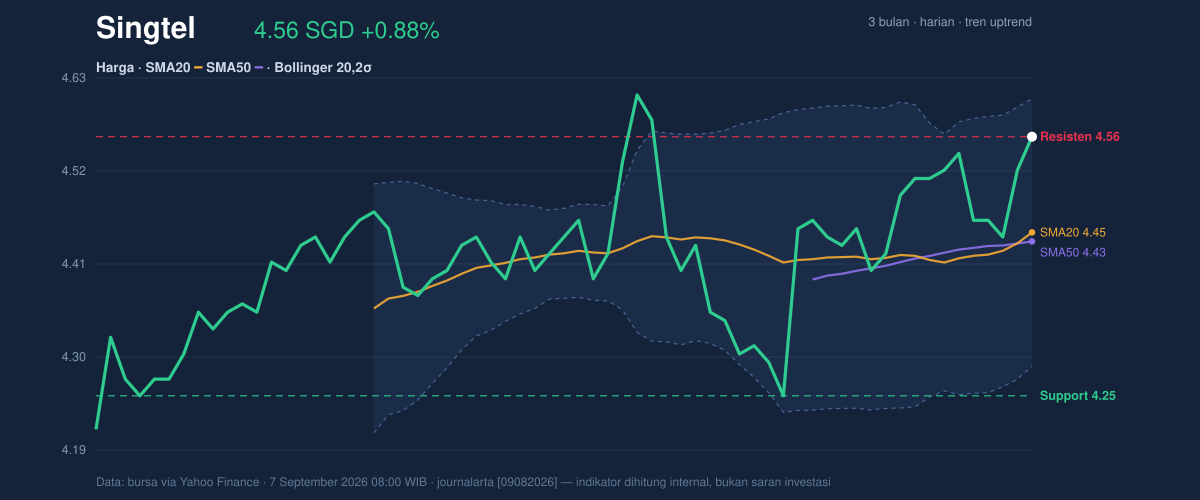
The signal here is not that the stock is overextended in a dramatic sense, but that it is being asked a simple question: can it hold above the recent ceiling, or does it fade back into the range?
Oscillators & Momentum
The momentum tools are supportive, but not perfectly aligned. MACD is positive at 0.029, above its signal line at 0.022, with a histogram of 0.007. In plain English, that means upward momentum still exists and has not yet rolled over. MACD is often treated as a trend-confirmation tool, so a positive reading above signal line generally argues that the current move has not exhausted itself.
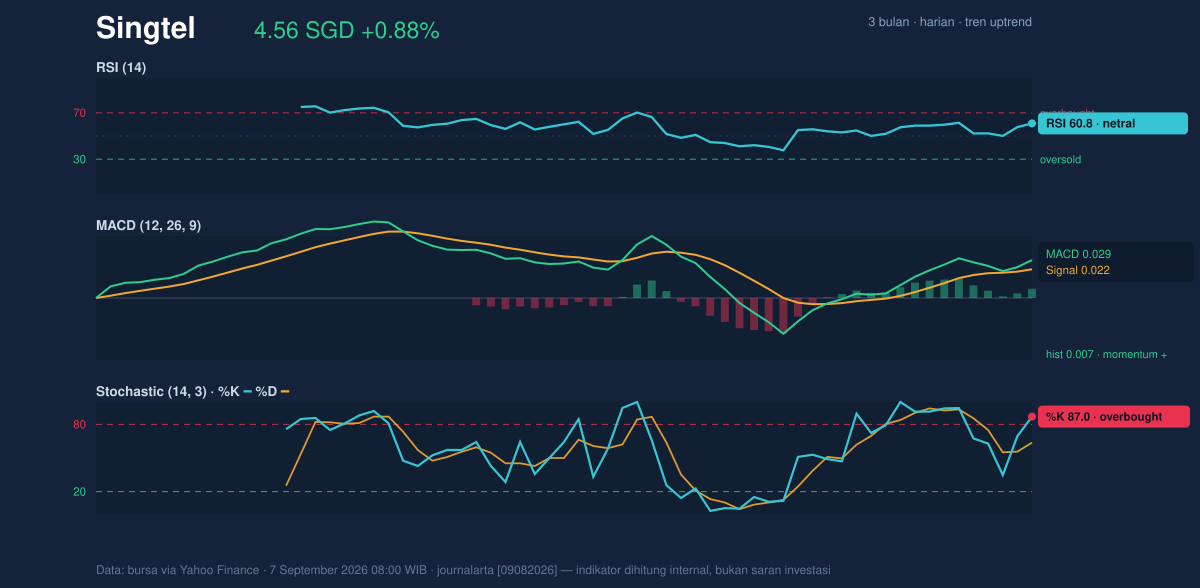
The caution comes from the faster oscillators. RSI at 60.8 is still neutral, which means the stock is not yet in a stretched condition by that measure. But Stochastic %K at 87.0 and %D at 63.8 are in overbought territory, indicating the recent rise has been quick enough to push near-term buying pressure toward its upper limit. That does not automatically mean reversal; it means the stock is more vulnerable to pauses, especially if fresh volume does not appear.
The combination is nuanced. MACD says the trend still has fuel. Stochastic says that fuel may be getting expensive to burn in the very short term. When those two disagree, price usually decides which signal matters more.
Volatility & Volume
Volatility is moderate, not explosive. ATR(14) at 0.07, equal to 1.6% of price, suggests the stock can move, but not in a disorderly way. More interesting is the Bollinger setup: the bands are relatively tight, with a 7.2% width, and the description points to a squeeze. That matters because a squeeze often precedes a sharper move once the market resolves direction. The stock is also near the upper band at 4.61, with %B at 86%, which means it is trading close to the top of the current volatility envelope.
That combination is usually read as a breakout test. If price can stay near the upper band while volatility remains compressed, the market may be preparing for expansion rather than exhaustion. If it slips back toward the middle band at 4.45, the message changes: the move was accepted, but only temporarily.
Volume complicates the picture. The latest turnover of 14,471,200 is only 0.6× the 20-hour average of 24,793,730. That is a quiet tape, and quiet tapes are often less reliable for confirming breakouts. Still, OBV is rising, which suggests that despite the lighter session volume, the broader accumulation trend has not broken down. In other words, participation has not disappeared; it has just become less urgent.
Key Levels & Scenarios
The chart shows a clear technical map. Immediate resistance sits at 4.56, exactly where the stock is trading, while support is 4.25. That makes the current price a decision point rather than a comfortable resting place. The 3-month range adds context: the stock is below the 4.70 high and above the 4.15 low, so it is trading in the upper half of its recent range without yet challenging the peak.
If Singtel can hold above 4.56 and maintain the 4.61 upper Bollinger band area, the chart would suggest that buyers are absorbing supply at the top of the range. If it fails to sustain that level, the first technical magnet is the 4.45 middle band and SMA20, followed by the 4.25 support zone.
Technical Verdict: HOLD (wait & see)
HOLD (wait & see)
- MACD remains positive, which supports the ongoing uptrend.
- Golden cross and price above SMA20 confirm the trend is still constructive.
- Stochastic is overbought and volume is light, so the current push needs confirmation.
Verdict invalidated if price falls below 4.25.
- Ideal Entry Range: 4.45 to 4.56
- Exit Target: 4.61 and then 4.70
- Stop Loss protection: below 4.25
For non-traders, this means the stock looks technically healthy, but it is sitting at a level where the next move needs proof rather than assumption.
Latest fact: OBV is rising.
Summary Data Singtel
| Last price | 4.56 SGD |
| Change 1 day / 5 days / 1 month | 0.88% / 0.44% / 6.05% |
| Trend / MA-cross | uptrend / golden |
| SMA20 / SMA50 | 4.45 / 4.43 |
| RSI (14) / Stochastic %K | 60.8 / 87.0 |
| Bollinger %B / ATR | 86% / 0.07 |
| Support / Resistance 20 days | 4.25 / 4.56 |
| Data as of | 7 September 2026 08:00 WIB |


