UOB Stock Drops 0.62%, Testing Key Resistance In Focus
On September 8, 2026: price 41.75 SGD, trend sideways, RSI 51.7, support 40.22, resistance 42.16. technical analysis of uob stock. UOB Stock Drops — full…

United Overseas Bank’s shares on SGX slipped to 41.75 SGD as of 7 September 2026 08:00 WIB, easing from the previous close of 42.01 and leaving the stock in a sideways pattern rather than a decisive trend. The move matters less for its size than for what it says about positioning: UOB is holding above its SMA20 at 41.27, but it remains below its SMA50 at 42.15, which keeps the medium-term picture mixed. In plain terms, the shares are neither breaking down nor breaking out; they are sitting in a zone where traders are waiting for the next signal.
Trend & Price Action
The chart shows a market that is still digesting the recent pullback from the upper part of its range. UOB is down 1 month -3.58%, yet the shorter horizon is less negative, with 5 days 0.46% and a modest daily decline of 0.62%. That combination usually points to consolidation rather than a fresh selloff. The stock is also trading near the middle-to-upper part of its recent band, at 79% of the 20-hour range between 40.22 support and 42.16 resistance, which means buyers have been able to keep price from slipping back to the lower end of the range.
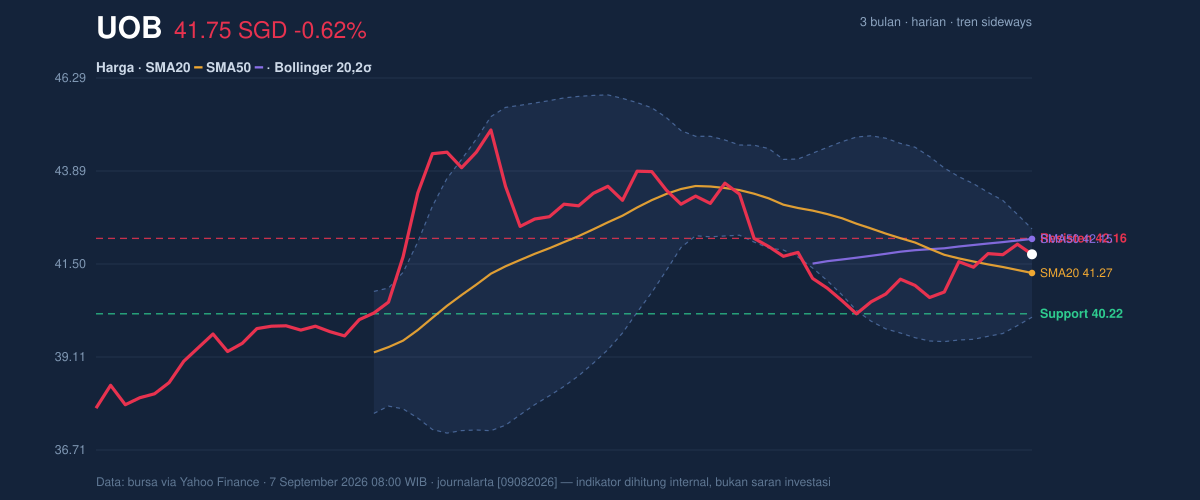
The more important signal is structural. The SMA20 at 41.27 sits below the last price, so the short-term bias is still intact, but the SMA50 at 42.15 is above the market and acts as a ceiling. With no new MA cross, there is no fresh trend confirmation from moving averages. The slope of the SMA20 at -0.91% over 5 days shows the short-term trend is still leaning down, even if the price has stabilized. That is why the stock reads as range-bound: support is holding, but upside conviction has not yet overtaken overhead supply.
Oscillators & Momentum
Momentum is steadier than the price chart alone might suggest. The RSI(14) at 51.7 is neutral, which means the stock is not overbought and not oversold; it is sitting in the middle, where direction is still undecided. The Stochastic %K at 74.1 and %D at 82.9 are also neutral, but they are close to the upper zone, implying the recent bounce has already done much of its work. In practice, that often means the stock can still rise, but it may need fresh volume to extend the move rather than simply drift higher.
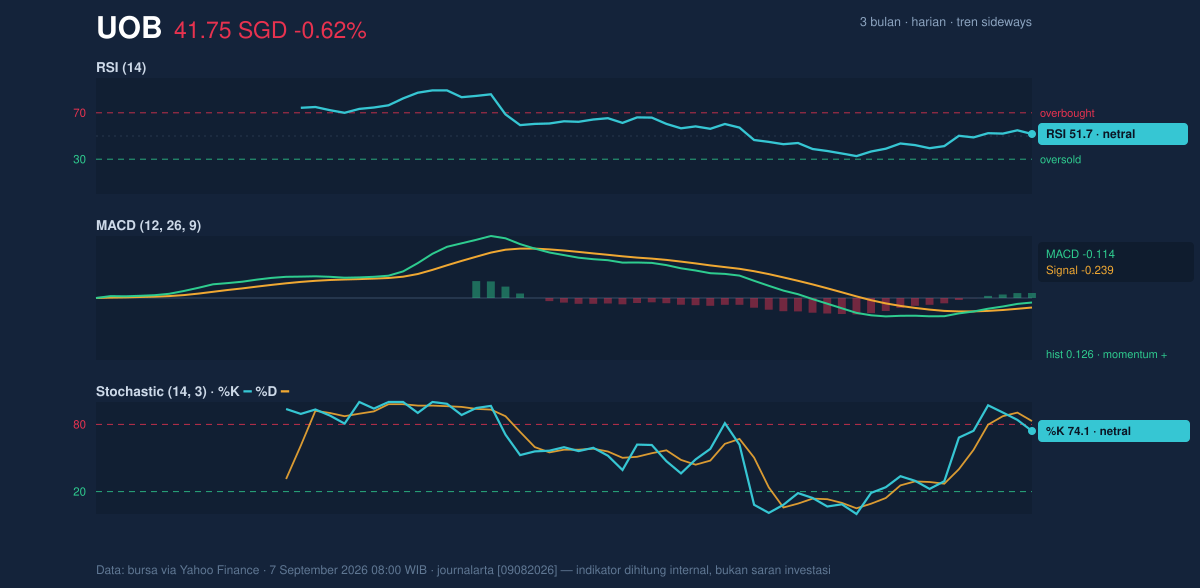
The cleaner signal comes from MACD. UOB’s MACD at -0.114 is still below zero, yet it is above the signal at -0.239, leaving a positive histogram of 0.126. That matters because it shows downside momentum is fading and short-term momentum has turned more constructive, even though the broader trend has not fully flipped. This is the kind of setup that often appears before a breakout attempt, but it is not confirmation on its own.
Volatility & Volume
Volatility is subdued, and that usually makes the next move more consequential when it comes. The ATR(14) at 0.52, equal to 1.3% of price, signals relatively low daily movement. At the same time, the Bollinger Bands are tightening, with a 5.5% band width that is explicitly in squeeze territory. A squeeze does not predict direction, but it does suggest compressed trading conditions and a higher chance of expansion once price leaves the current range.
The position inside the band is also informative. With %B at 71%, UOB is in the upper half of its Bollinger envelope but not at the top edge. That usually means the stock has room to test resistance, yet it has not entered the kind of stretched condition that often precedes an immediate pullback. The catch is participation: recent volume of 1,766,800 is only 0.5× the 20-hour average of 3,467,330. Thin volume weakens the message from the price bounce, because rallies on light turnover often struggle to sustain themselves. Still, OBV is rising, which suggests the quieter tape has not stopped net accumulation from improving.
Key Levels & Scenarios
The chart’s nearest reference points are clear. 40.22 is the key support to watch, while 42.16 is the immediate resistance. Above that, the SMA50 at 42.15 sits almost directly on top of resistance, reinforcing that zone as the first real test. If price can clear that cluster, the upper Bollinger band at 42.41 becomes the next visible marker, and a move there would suggest the squeeze is resolving to the upside. If the stock fails to hold 40.22, the market would likely be signaling that the recent stabilization has failed and that the lower part of the range around 37.52 could come back into view.
The strongest reading here is that UOB is holding a neutral-to-cautious technical posture with improving momentum, but it still needs volume and a clean break above resistance to confirm a stronger advance. That is the core message from the chart: the stock is not weak enough to dismiss, yet not strong enough to call decisive.
Technical Verdict: HOLD (wait & see)
- Verdict: HOLD (wait & see)
- Reason 1: MACD histogram is positive, which shows momentum is improving even though MACD remains below zero.
- Reason 2: Price is above SMA20 but still below SMA50, so the short-term recovery has not yet reclaimed the medium-term trend.
- Reason 3: Bollinger Bands are squeezing, which points to a pending expansion, but the low volume means the signal is not yet fully validated.
- Verdict invalidated if price falls below 40.22, because that would break the nearest support and weaken the current range structure.
- Ideal Entry Range: 41.27 to 41.75
- Exit Target (Target Price): 42.16 to 42.41
- Stop Loss protection: below 40.22
In plain English, UOB looks stable for now, but the chart is waiting for a stronger signal before the next move becomes clear.
Summary Data UOB
| Last price | 41.75 SGD |
| Change 1 day / 5 days / 1 month | -0.62% / 0.46% / -3.58% |
| Trend / MA-cross | sideways / none |
| SMA20 / SMA50 | 41.27 / 42.15 |
| RSI (14) / Stochastic %K | 51.7 / 74.1 |
| Bollinger %B / ATR | 71% / 0.52 |
| Support / Resistance 20 days | 40.22 / 42.16 |
| Data as of | 7 September 2026 08:00 WIB |


