ADBE Momentum Weakens: Stock Gains 5.30% (September 15, 2026)
On September 15, 2026: price 265.60 USD, trend sideways, RSI 50.7, support 248.83, resistance 292.79. technical analysis of adbe stock.

Adobe Inc. slipped to 265.60 USD on NASDAQ, above the prior close but still trading below its 20-day average of 271.56, a pattern that signals the stock is trying to stabilize without yet reclaiming short-term control. The move matters because Adobe is sitting in a technically mixed zone: the broader structure is sideways, the 50-day average at 253.53 is still below price, and momentum gauges are not confirming a fresh breakout. In plain language, the shares are not breaking down, but they are also not showing the kind of force that usually accompanies a clean trend change.
Trend & Price Action
As shown in the chart, Adobe’s price is hovering in the middle of a broad range rather than pressing either edge. The stock is below SMA20 at 271.56, which tells traders the latest rebound has not yet overpowered the short-term trend. At the same time, the share price remains above SMA50 at 253.53, so the intermediate trend has not rolled over into a clear downtrend. That combination often points to consolidation: buyers are present, but they have not seized enough momentum to force a sustained move higher.
The lack of a new MA-cross also matters. A moving-average crossover is one of the cleaner signs that trend direction is changing; without it, the chart is still waiting for confirmation. The 20-day SMA slope of -0.93% over 5 days adds a mild bearish tilt, suggesting the short-term path is still drifting lower even though the broader picture is not broken.
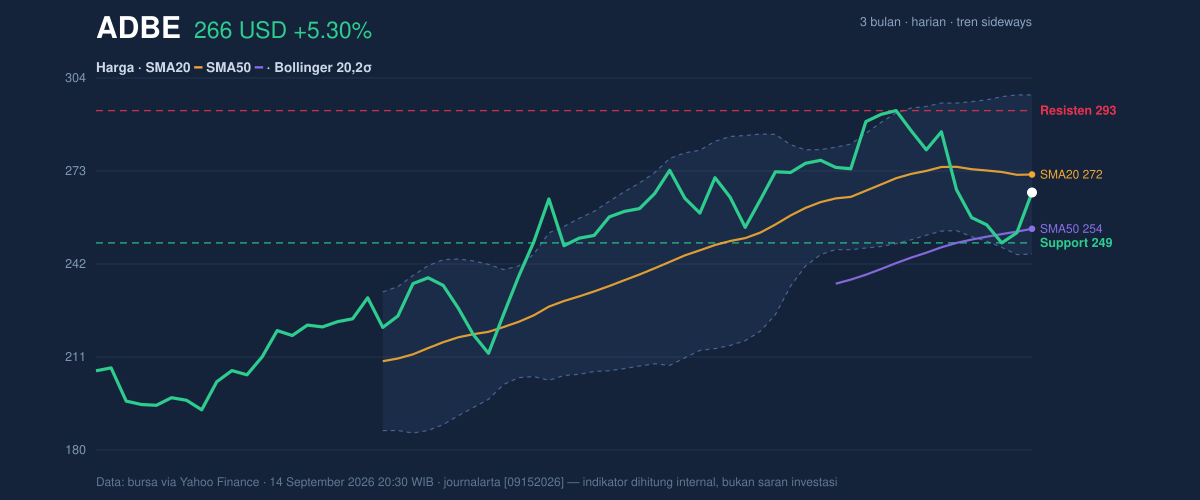
The stock is also trading at about 38% of its 20-day range, which places it closer to support than resistance but not at the extreme low end. That positioning suggests the market is cautious rather than panicked.
Oscillators & Momentum
The momentum picture is more subdued than the price change alone might imply. As shown in the chart, RSI at 50.7 sits almost exactly on neutral territory, which usually means neither buyers nor sellers have a decisive edge. This is important because it tells readers the latest advance has not pushed the stock into overbought conditions, but it also has not produced enough strength to signal a strong trend extension.
The Stochastic at 45.4 / 23.0 is also neutral, but with the faster line above the slower line, it hints at some short-term recovery pressure. That is not a full bullish signal; it simply means downside momentum may be easing. The more important read comes from MACD: MACD 1.083 versus signal 5.433, with a histogram of -4.350. A negative histogram means the MACD line is still below its signal line, a classic sign that momentum remains negative even if price has bounced. In other words, the chart is not showing collapse, but it is also not showing convincing acceleration.
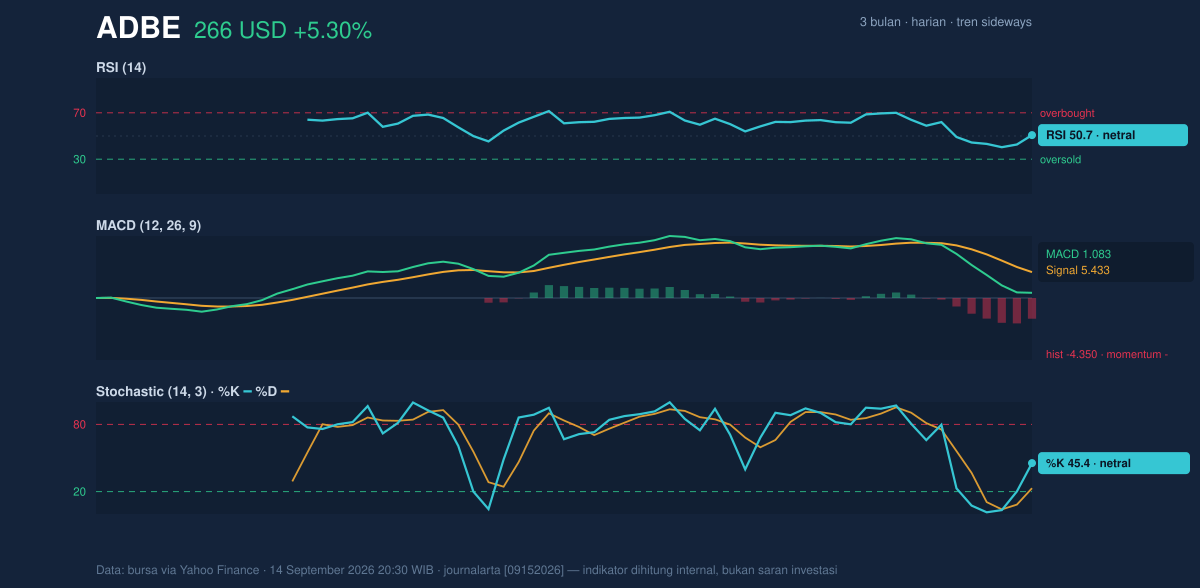
This is the kind of setup where price can drift sideways for a while unless momentum improves.
Volatility & Volume
Volatility is not asleep. The ATR of 11.03, equal to 4.2% of price, indicates the stock can move meaningfully in a single session. For a large-cap software name, that is a reminder that even “quiet” charts can produce sharp swings once a level gives way.
Bollinger Bands help frame that risk. Adobe is trading around %B 39%, which places the price in the lower-middle part of the band structure rather than near the top. The upper band at 298.01 and lower band at 245.11 define the current technical corridor, while the 19.5% band width suggests volatility is normal rather than compressed. That matters because a normal-width band does not usually precede an explosive move on its own; it more often reflects an already-established range.
Volume adds a modest layer of confirmation. Last volume of 5,718,700 was only 1.1× normal, so the latest move was supported by participation, but not by a surge that would imply strong conviction. More telling is that OBV is down. On-balance volume tracks whether volume is flowing with price; a falling OBV while price stabilizes can mean rallies are not yet being backed by sustained accumulation.
Key Levels & Scenarios
The chart’s key map is clear. Immediate support at 248.83 sits just above the 3-month low of 190.12, while resistance at 292.79 is only a little below the 3-month high of 294.53. That means Adobe is trading inside a relatively well-defined corridor, with the market still respecting both sides of the range.
If the stock holds above 248.83, it keeps the current sideways structure intact and leaves room for a move back toward 271.56 and then 292.79. If it fails to hold 248.83, the chart would lose its nearest support cushion and the lower Bollinger zone at 245.11 becomes the next technical reference. A break above 292.79 would be more meaningful because it would test the upper end of the recent range and bring the 298.01 band into view.
Technical Verdict: HOLD (wait & see)
HOLD (wait & see) is the cleanest read from the current setup.
- RSI 50.7 and Stochastic 45.4 / 23.0 are neutral, so momentum is not strong enough to justify a directional call.
- MACD histogram -4.350 shows momentum is still negative, even though price has bounced.
- Price below SMA20 at 271.56 but above SMA50 at 253.53 points to consolidation, not a confirmed trend break.
- Verdict invalidated if price breaks below 248.83, because that would weaken the nearest support and shift the chart toward a more defensive setup.
- Ideal Entry Range: 248.83 to 253.53
- Exit Target: 271.56 to 292.79
- Stop Loss protection: below 245.11
For non-traders, this means Adobe’s chart is not showing enough strength or weakness yet to force a clear directional read, so the market is waiting for confirmation from the next move.
Summary Data ADBE
| Last price | 265.60 USD |
| Change 1 day / 5 days / 1 month | 5.30% / -0.34% / 0.60% |
| Trend / MA-cross | sideways / none |
| SMA20 / SMA50 | 271.56 / 253.53 |
| RSI (14) / Stochastic %K | 50.7 / 45.4 |
| Bollinger %B / ATR | 39% / 11.03 |
| Support / Resistance 20 days | 248.83 / 292.79 |
| Data as of | 14 September 2026 20:30 WIB |



