PANW Stock Analysis: Gains 13.09%, Momentum Weakens
On September 15, 2026: price 373.94 USD, trend sideways, RSI 57.8, support 328.48, resistance 382.85. technical analysis of panw stock.

Palo Alto Networks jumped to 373.94 USD in the latest Nasdaq session, according to exchange-linked data, after a 13.09% one-day surge that pushed the shares back above their short-term averages. It was a sharp move, but not yet a clean trend change. The stock is still working through a sideways pattern, and the chart suggests the market is testing whether this rebound has real follow-through or is simply a fast bounce inside a broader range.
Trend & Price Action
The first signal is that PANW now sits above its SMA20 at 352.74 and above its SMA50 at 350.06, which is constructive because short-term buyers have reclaimed the levels that often act as a floor in a choppy market. But the wider context matters: the trend is still labeled sideways, and the SMA20 slope is -3.04% over 5 days, a reminder that the recent average is still pointing down even as price has bounced.
That combination usually means the market has not yet committed to a sustained breakout. The stock is also trading near the upper part of its recent band, at 84% of the 20-hour range, which shows momentum is strong enough to challenge resistance but also leaves less room before the next test of overhead supply. As shown in the chart, the price is approaching the upper Bollinger band rather than sitting near the middle, which often signals strength but also a more crowded trade.
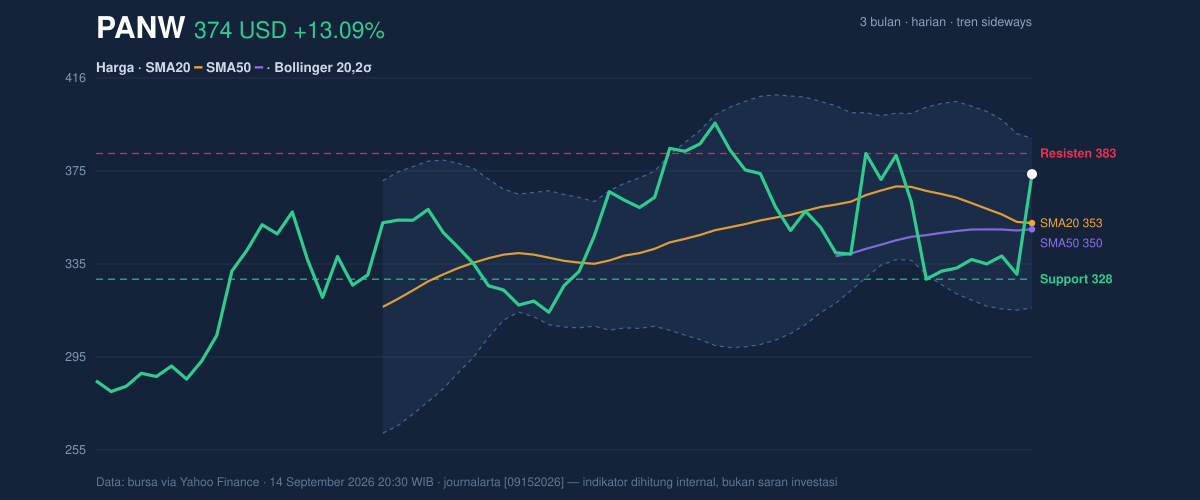
The nearest reference points are clear: support at 328.48 and resistance at 382.85. That resistance matters because it is close enough to the current price to act as the next decision point. If the stock can clear that area, it would be a sign that the rebound is expanding beyond a one-day reaction. If it fails there, the move risks becoming another swing inside the range rather than a new leg higher. The broader 3-month band, from 274.33 to 398.88, shows there is still room above if buyers keep control, but also that the stock has already moved back into the upper half of its recent territory.
Oscillators & Momentum
The momentum picture is mixed rather than fully bullish. RSI at 57.8 is neutral, which means the stock is not stretched into overbought territory even after the sharp gain. That is helpful: it suggests the rally has not yet exhausted itself purely on momentum grounds. But the more important signal comes from the MACD, where MACD is -2.135 versus a signal line at -1.148, with a negative histogram of -0.987. In plain English, the trend-following momentum measure is still below zero and still lagging its trigger line, which means the recent rebound has not fully flipped the underlying momentum profile.
Stochastic adds a second layer of nuance. %K at 79.7 and %D at 39.9 show the fast line well above the slower line, which often reflects a strong short-term push. But because the reading is still described as neutral, the message is not an outright breakout signal; it is more of a sign that buyers have regained control of the near-term tape without yet proving durability.
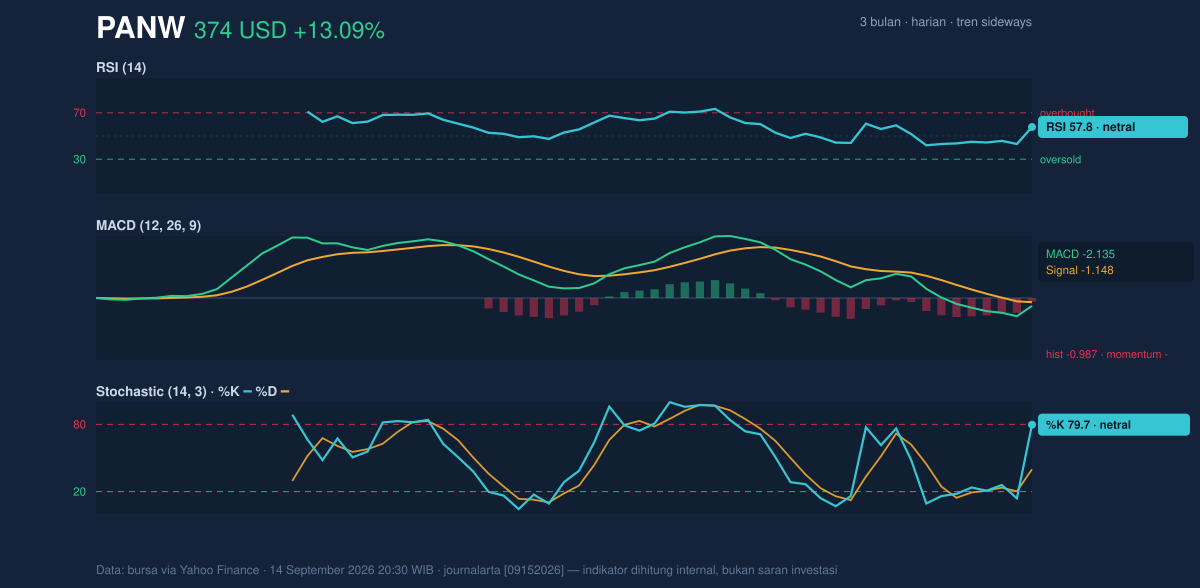
Taken together, the oscillators say the stock is recovering, but not cleanly enough to call the move fully confirmed. That matters because when RSI is neutral while MACD remains negative, the market is often in a transitional phase: price can continue higher, but it still needs follow-through volume and a decisive move through resistance to turn the rebound into a trend.
Volatility & Volume
Volatility is elevated. The Bollinger band width is 20.8% and is expanding, while ATR is 22.01, or 5.9% of price. Those readings mean the stock is capable of large swings in either direction, and the latest move should be read in that context. Expanding bands usually appear when a market is leaving a quieter phase, but they do not tell you the direction on their own. They simply warn that the next sessions could be more forceful than usual.
The price is also at %B of 79%, which means it is trading closer to the top of the Bollinger envelope than the middle. That is a sign of strength, but it also means the stock is no longer cheap relative to its recent volatility band. If price keeps pressing toward the upper band at 389.44, traders will be watching whether the move is supported by participation.
Volume suggests it is. The latest session recorded 12,013,600 shares, about 1.9× the 20-hour average of 6,442,615, and OBV is rising. That combination is important because rising volume and rising on-balance volume usually indicate that the move is not just mechanical; more shares are changing hands in the direction of the advance. In market terms, that is the kind of participation that can help a rebound survive after the first burst of enthusiasm fades.
Technical Verdict: HOLD (wait & see)
HOLD (wait & see)
The setup is improved, but not yet fully confirmed.
- Reason 1: Price is above SMA20 at 352.74 and SMA50 at 350.06, which supports the rebound.
- Reason 2: Volume at 1.9× average and OBV rising show real participation behind the move.
- Reason 3: MACD remains negative, so the broader momentum has not fully turned, even though RSI is neutral at 57.8.
Verdict invalidated if price falls below 328.48, the listed support that would signal the rebound has lost its footing.
- Ideal Entry Range: 352.74 to 373.94
- Exit Target: 382.85 to 389.44
- Stop Loss protection: 328.48
In plain English: the stock has improved, but it still needs to prove that this jump is more than a fast rebound.
Summary Data PANW
| Last price | 373.94 USD |
| Change 1 day / 5 days / 1 month | 13.09% / 12.21% / -2.69% |
| Trend / MA-cross | sideways / none |
| SMA20 / SMA50 | 352.74 / 350.06 |
| RSI (14) / Stochastic %K | 57.8 / 79.7 |
| Bollinger %B / ATR | 79% / 22.01 |
| Support / Resistance 20 days | 328.48 / 382.85 |
| Data as of | 14 September 2026 20:30 WIB |


