Testing Key Resistance, UOB Stock Gains 2.59% Today
On September 15, 2026: price 42.33 SGD, trend sideways, RSI 58.1, support 40.22, resistance 42.33. technical analysis of uob stock. Testing Key Resistance —…

United Overseas Bank (UOB) rose to SGD 42.33 on SGX in Singapore on 14 September 2026, pushing to the top of its recent trading range as volume jumped to 4,836,400, or about 1.7x its 20-day average, according to exchange data and Yahoo Finance. The move matters because it came with price sitting above the short-term average and right at a technical ceiling, a combination that often signals either a breakout attempt or a stall if buyers cannot keep up the pace.
Trend & Price Action
The broader pattern is still best described as sideways, but the latest price action is testing that label. UOB is trading above SMA20 at 41.20, which tells us the stock has recovered enough in the near term to stay above its short-term trend line, while SMA50 at 42.30 sits almost exactly where the last price printed. That close alignment is important: when price meets the medium-term average, it often acts as a decision point rather than a simple checkpoint.
As shown in the chart, the share price is also at the upper edge of its 20-day resistance at 42.33, which means the market is probing for acceptance above a level that has capped recent gains. The slope of SMA20 at -0.17% over 5 days still leans slightly down, so the short-term trend has not fully flipped even though the spot price is firmer. In plain terms, the stock has improved, but the chart has not yet delivered a clean trend change.
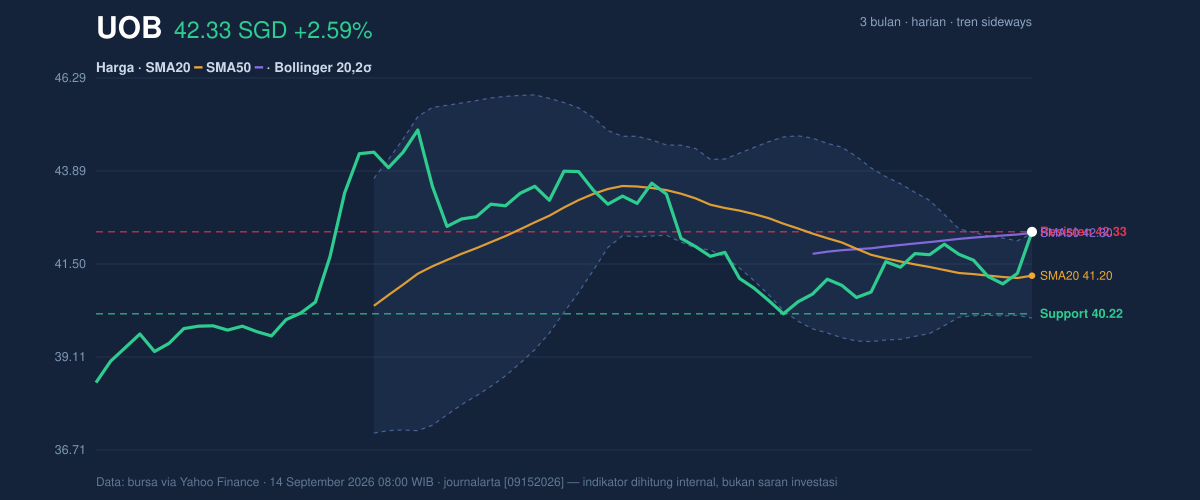
The Bollinger setup reinforces that tension. UOB is trading at %B 102%, which means price is moving just beyond the upper band at 42.29. That is a sign of strength, but not automatically of durability. When a stock pushes above the upper band while the band width is only 5.3%, the market is often compressed enough to allow a sharper move either way; the current squeeze suggests the next directional move could be meaningful if volume persists.
Oscillators & Momentum
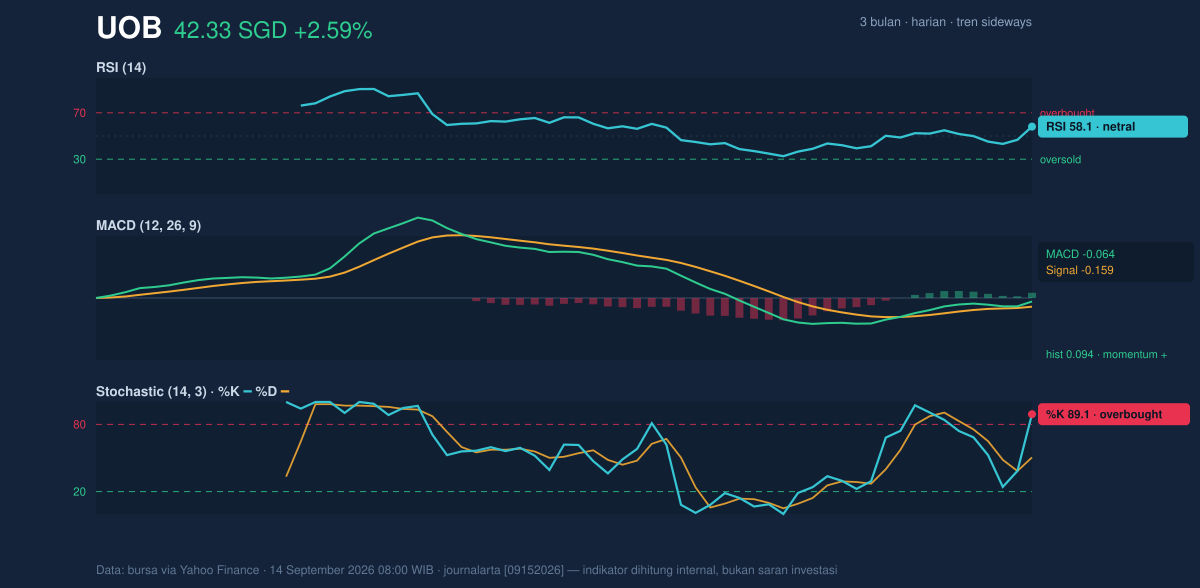
The momentum picture is mixed, which is exactly what traders would expect near resistance. RSI(14) at 58.1 is neutral, so the stock is not showing the kind of stretched condition that usually precedes an immediate reversal. That leaves room for further upside, but not much cushion if enthusiasm fades.
The more cautionary signal comes from the stochastic reading. Stochastic %K at 89.1 versus %D at 50.6 is an overbought configuration, meaning the latest push has been strong and fast relative to recent history. On its own, that does not mean the stock must fall; it means the market has become more vulnerable to pauses, especially if price cannot convert resistance into support.
The MACD is the cleaner bullish element here. MACD at -0.064 is still slightly below zero, but it is above the signal line at -0.159, and the histogram at 0.094 shows positive momentum building. In practical terms, the trend engine is improving even though it has not fully crossed into a strong bullish regime. That combination often appears early in a potential continuation move, but it needs confirmation from price holding above the band and average levels.
Volatility & Volume
Volatility is subdued by design right now. ATR(14) at 0.55, or about 1.3% of price, says daily movement has been relatively contained. That matters because a low ATR near resistance can create a sudden expansion if the market breaks out, but it can also mean the stock may need fresh catalysts to keep moving.
Volume is the most interesting confirming signal in the session. The jump to 4,836,400 against a 20-day average of 2,853,555 suggests real participation rather than a thin, technical flicker. Heavy trading near resistance usually means institutions or larger holders are active, and that can support a breakout attempt if the buying is sustained. Yet OBV is down, which is a useful warning: on-balance volume measures whether volume has been accumulating in the direction of price, and a falling OBV implies the broader flow of money has not fully turned constructive. In other words, the day’s volume surge is encouraging, but it has not yet erased the longer-running distribution signal.
Key Levels & Scenarios
The immediate map is clear. Support at 40.22 is the first level where buyers have recently shown up, and it sits below both SMA20 at 41.20 and the lower Bollinger band at 40.11. If price slips back under that area, the recent advance would look less like a breakout attempt and more like a failed test of range resistance.
On the upside, 42.33 is now the key line to watch because it matches both the latest high and the upper edge of the 20-day range. A sustained move above that zone would invite attention toward the broader 3-month high at 45.15, but the chart first needs to prove it can hold above the current ceiling. The lower end of the three-month band, 38.20, remains the deeper reference point if the structure weakens materially.
Technical Verdict: HOLD (wait & see)
HOLD (wait & see)
- MACD histogram at 0.094 is positive, showing improving momentum.
- Price at 42.33 is pressing against resistance at 42.33 and the SMA50 at 42.30, so confirmation is still needed.
- Stochastic at 89.1 is overbought, which raises the risk of a pause after the recent jump.
- Verdict invalidated if price falls below 40.22, which would weaken the short-term base and reopen the lower band.
- Ideal Entry Range: 41.20 to 42.33
- Exit Target: 42.33 initially, then 45.15 if the breakout holds
- Stop Loss protection: 40.22, with deeper risk below 40.11
For non-traders, this means the stock is improving, but it is still standing at a technical door that has not clearly opened yet.
Summary Data UOB
| Last price | 42.33 SGD |
| Change 1 day / 5 days / 1 month | 2.59% / 1.39% / 2.92% |
| Trend / MA-cross | sideways / none |
| SMA20 / SMA50 | 41.20 / 42.30 |
| RSI (14) / Stochastic %K | 58.1 / 89.1 |
| Bollinger %B / ATR | 102% / 0.55 |
| Support / Resistance 20 days | 40.22 / 42.33 |
| Data as of | 14 September 2026 08:00 WIB |



