Testing Key Resistance, T Stock Gains 0.79% Today
On September 16, 2026: price 26.72 USD, trend uptrend, RSI 67.2, support 24.90, resistance 26.72. technical analysis of t stock. Testing Key Resistance — full…

AT&T closed at 26.72 USD, up 0.79% on the day and 8.27% over the past month, with the stock now pressing against the top of its recent trading band. That matters because the move is not just a one-day bounce: the shares are sitting above their short-term trend line, but the momentum tools are starting to argue for caution rather than chase.
Trend & Price Action
The broader setup remains constructive. AT&T is in an uptrend, with the SMA20 at 25.73 rising at 1.40% over five days, and the stock trading above the SMA20 and well above the SMA50 at 24.11. In plain terms, the market is still rewarding the recent trend, and the distance above the longer average suggests the rebound is not a random spike.
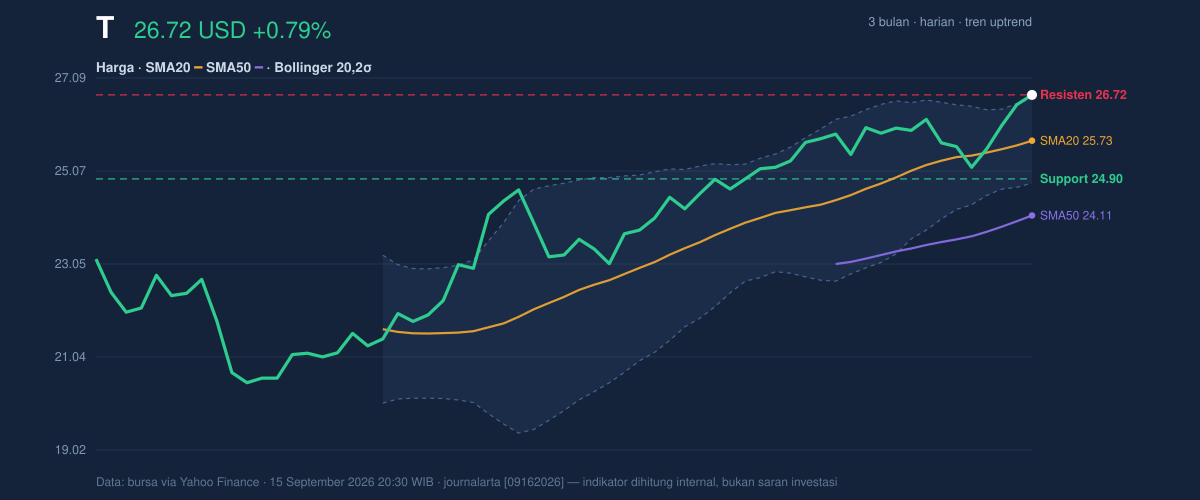
The chart also shows a more nuanced message. Price is at the 100% level of the 20-hour range, with 20-hour support at 24.90 and 20-hour resistance at 26.72. That means the stock is currently testing the ceiling of its near-term range rather than sitting comfortably in the middle of it. The 3-month high at 26.93 is now close enough to matter: if the shares can move through that zone, the market would be signaling that buyers are willing to pay fresh highs after a steady climb. If not, the current level can become a place where momentum cools.
The Bollinger Bands add an important twist. The upper band sits at 26.65, just below the last price, while the middle band is 25.73 and the lower band 24.81. With %B at 104%, AT&T is trading slightly beyond the upper band, which often signals strength but also tells readers the stock is stretched relative to its recent average. The 7.1% band width is also narrowing, suggesting a squeeze. That combination usually means the market is building pressure for a larger move, but it does not say which direction that move will take.
Oscillators & Momentum
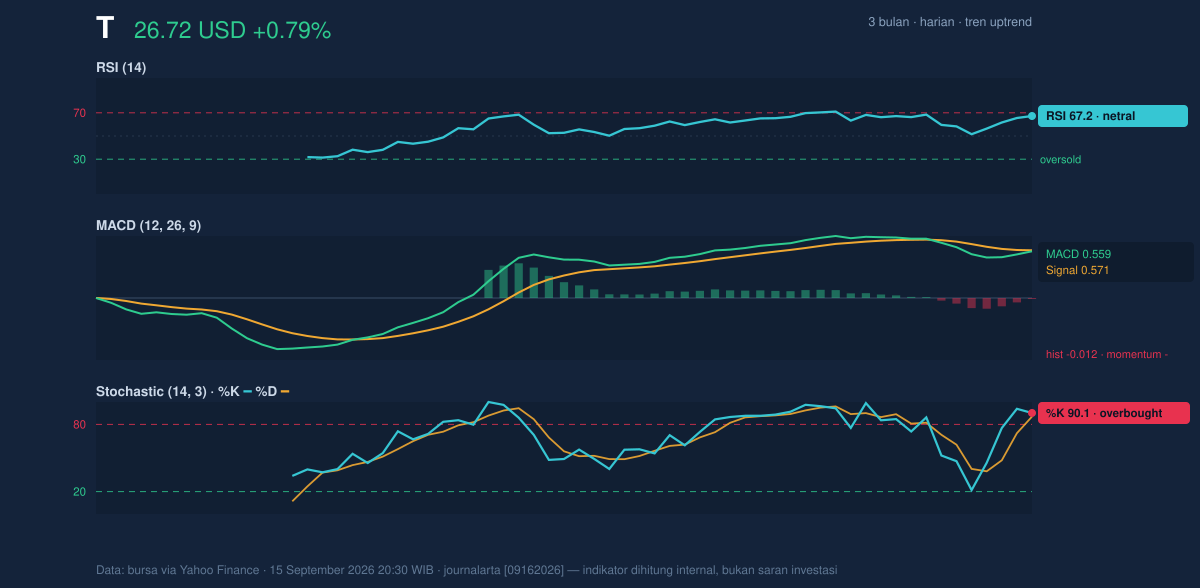
This is where the story turns more cautious. The RSI(14) at 67.2 is technically still neutral, but it is close to the overbought zone, which means the stock has already done a lot of the near-term work. More telling is the Stochastic %K at 90.1 and %D at 87.0, both overbought. Stochastic is a faster gauge of price pressure, and readings this high usually mean the stock is near the upper end of its recent range and vulnerable to pauses or pullbacks if buying slows.
The MACD at 0.559 remains above zero, which keeps the broader trend intact, but the signal line at 0.571 is slightly higher and the histogram at -0.012 has slipped negative. That small negative spread means upside momentum is fading even while the trend itself has not broken. In practical terms, the stock is still advancing, but the pace of that advance is no longer accelerating. For a name already leaning on its upper band and near a recent high, that is a meaningful warning flag.
Volatility & Volume
Volatility is moderate, not chaotic. The ATR(14) at 0.54, or about 2.0% of price, suggests the average daily swing is manageable. But because the Bollinger Bands are tightening, the market may be preparing for a larger-than-usual move after a period of compression. That can be constructive if buyers remain in control, or it can produce a sharper retreat if the stock fails to hold the breakout area.
Participation is supportive. Last volume was 37,332,500, about 1.1x normal versus the 20-hour average of 32,878,605, and OBV is rising. OBV, or on-balance volume, tracks whether volume is flowing into or out of the stock. A rising OBV alongside higher price usually confirms that the move has real participation behind it, which is better than a thin rally built on limited trading.
Key Levels & Scenarios
The immediate battle is straightforward. Resistance at 26.72 is already being tested, with the more important overhead marker at the 3-month high of 26.93. On the downside, the first line to watch is 24.90 support, followed by the SMA20 at 25.73 and the Bollinger middle band at 25.73, which now act as a shared pivot.
If AT&T can hold above the current band and push through 26.93, the chart would confirm that the squeeze is resolving upward. If it slips back under 25.73, the message changes quickly: the stock would be giving up the short-term trend and inviting a move back toward 24.90.
Technical Verdict: HOLD (wait & see)
HOLD (wait & see)
- Reason 1: The trend is still positive, with price above the SMA20 and SMA50, and OBV is rising, which supports the idea that buyers remain engaged.
- Reason 2: Stochastic is overbought and MACD histogram is negative, showing momentum is fading even as price stays elevated.
- Reason 3: The stock is trading at the upper Bollinger Band with %B at 104%, so it is extended and vulnerable to a pause unless it clears the nearby high.
- Verdict invalidated if price falls below 24.90, because that would break the nearest support and weaken the short-term structure.
- Ideal Entry Range: 25.73 to 24.90
- Exit Target (Target Price): 26.93
- Stop Loss protection: below 24.81
In plain English: the stock still looks healthy, but it is stretched enough that the next move matters more than the last one.
“Momentum is still there — but at this level, the market is asking for proof.”
Summary Data T
| Last price | 26.72 USD |
| Change 1 day / 5 days / 1 month | 0.79% / 4.37% / 8.27% |
| Trend / MA-cross | uptrend / none |
| SMA20 / SMA50 | 25.73 / 24.11 |
| RSI (14) / Stochastic %K | 67.2 / 90.1 |
| Bollinger %B / ATR | 104% / 0.54 |
| Support / Resistance 20 days | 24.90 / 26.72 |
| Data as of | 15 September 2026 20:30 WIB |


