ORCL Stock Technicals Today: Gains 2.00%, Momentum Weakens
On September 17, 2026: price 143.16 USD, trend sideways, RSI 45.3, support 140.35, resistance 162.52. technical analysis of orcl stock.

Oracle’s shares are trying to stabilize after a sharp weekly slide, but the chart still says the burden of proof sits with the bulls: the stock is 143.16 USD, above the 50-day average but below the 20-day average, with momentum still leaning weak as traders digest a 5-day drop of 11.43%.
Trend & Price Action
Oracle closed at 143.16 USD, up 2.00% on the day from 140.35, but that bounce needs context. The shares remain below SMA20 at 148.80 while holding above SMA50 at 140.73, which is a classic sign of a stock caught between short-term pressure and a longer base of support. In plain terms, the near-term trend is still soft, but the medium-term floor has not given way.
The slope of SMA20 is -0.60% over 5 days, which matters because a falling short-term average usually means recent prices have been drifting lower rather than building upward momentum. There is no new MA-cross, so the chart is not showing a fresh bullish or bearish crossover signal yet. That leaves Oracle in a sideways pattern rather than a decisive trend.
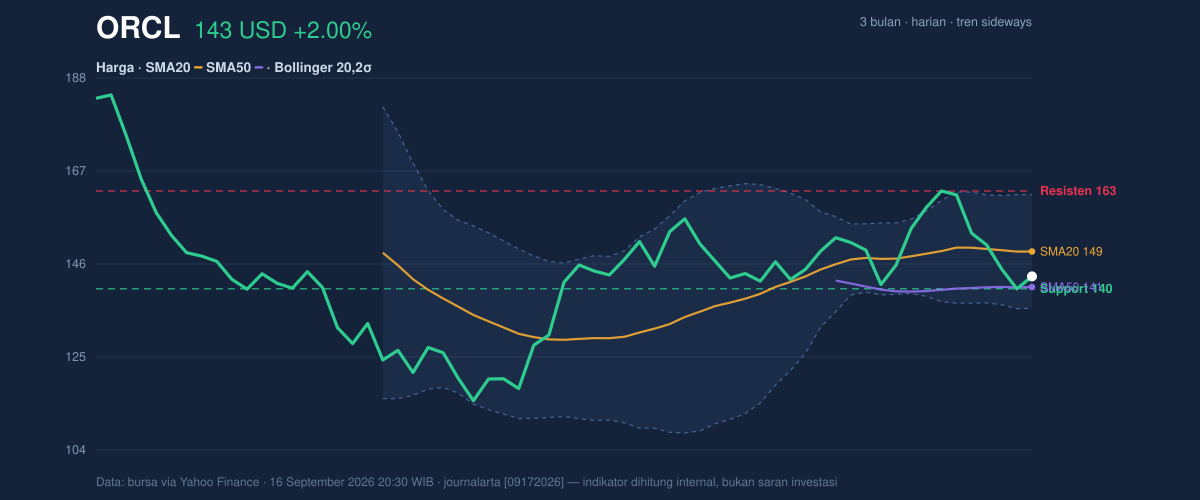
The price is also sitting near the lower half of its recent range: 13% of the 20-hour range, with 20-hour support at 140.35 and 20-hour resistance at 162.52. That positioning suggests the market is still testing whether the recent rebound is a real turn or just a pause after selling.
Oscillators & Momentum
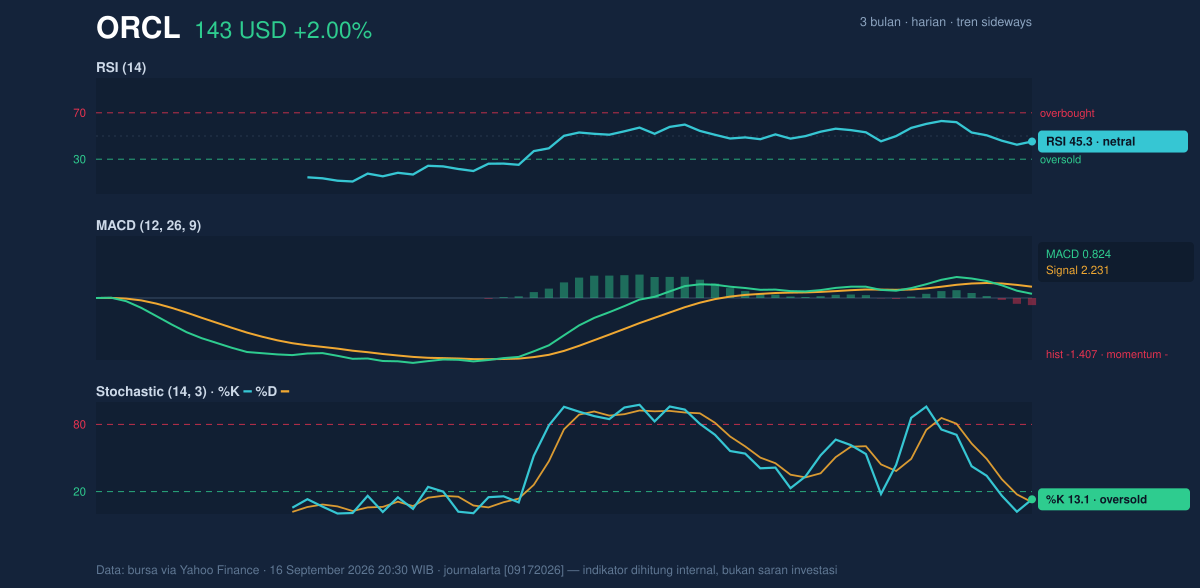
The momentum tools are mixed, and that mix is important. RSI at 45.3 is neutral, which means the stock is neither stretched nor washed out on this measure. But the Stochastic at 13.1 / 10.5 is in oversold territory, a sign that short-term selling has been heavy enough to push the stock close to a rebound zone. That does not guarantee a reversal; it only says the downside may be more compressed than it was earlier in the week.
The stronger warning comes from MACD. MACD at 0.824 sits below its signal at 2.231, and the -1.407 histogram shows momentum is still negative. In practical terms, MACD is saying the recent recovery has not yet overpowered the prior downswing. When MACD stays below the signal line, rallies often struggle unless volume and breadth improve.
So the oscillator picture is not bearish in a panic sense, but it is not confirming a clean rebound either. Oversold Stochastic may invite a bounce, while MACD says the broader short-term momentum has not turned.
Volatility & Volume
Oracle’s ATR(14) of 7.90, equal to 5.5% of price, points to elevated day-to-day movement. That means the stock can travel quickly in either direction, and small changes in sentiment may produce outsized price swings. The Bollinger Bands reinforce that message: the stock is near the lower half of the band structure, with %B at 28%, below the middle band at 148.80 and well under the upper band at 161.68. In simple terms, Oracle is trading closer to the lower band than the upper one, which often reflects pressure rather than strength.
The band width is 17.3%, described as normal, so this is not a squeeze setup. A squeeze would suggest a coming volatility burst; here, the market already has room to move, and the ATR says it is already doing so. Volume adds a small but meaningful confirmation: 34,209,600 shares traded versus a 20-hour average of 29,036,620, or 1.2× normal. That tells us the move is not happening on thin participation.
Yet OBV is falling, which is the caution flag. OBV, or on-balance volume, tracks whether volume is flowing into up days or down days. A declining OBV while price tries to bounce means buyers have not fully taken control; rallies may be running into supply.
Key Levels & Scenarios
The immediate map is clear. Support at 140.35 is the first line the market has already tested. Below that, the next reference is the SMA50 at 140.73, which is unusually close and may act as a nearby technical floor. Above, 148.80 is the first major hurdle because it aligns with the SMA20 and the Bollinger middle band. Beyond that, the next visible ceiling is 162.52.
If Oracle holds 140.35 and starts reclaiming 148.80, the chart would begin to look less defensive and more constructive, especially if MACD narrows its gap and OBV stops falling. If it fails to hold 140.35, the recent bounce loses credibility quickly, and the market would likely shift attention toward the lower Bollinger band at 135.91. The stock is also far from its 3-month high of 190.19 and above its 3-month low of 114.50, which underscores how much room remains in either direction.
Technical Verdict: HOLD (wait & see)
HOLD (wait & see)
- RSI at 45.3 is neutral, so the stock is not showing a strong directional edge.
- Stochastic is oversold, which supports the possibility of a bounce, but MACD remains negative, so the rebound is not yet confirmed.
- Price is below SMA20 at 148.80 but above SMA50 at 140.73, a mixed structure that usually calls for patience rather than commitment.
Verdict invalidated if price falls below 140.35.
- Ideal Entry Range: 140.35 to 143.16
- Exit Target: 148.80, then 162.52
- Stop Loss protection: below 135.91
In plain English: Oracle is not breaking down, but it has not yet proved that the recent bounce is strong enough to trust.
“The stock is still asking for confirmation, not applause.”
Summary Data ORCL
| Last price | 143.16 USD |
| Change 1 day / 5 days / 1 month | 2.00% / -11.43% / 0.26% |
| Trend / MA-cross | sideways / none |
| SMA20 / SMA50 | 148.80 / 140.73 |
| RSI (14) / Stochastic %K | 45.3 / 13.1 |
| Bollinger %B / ATR | 28% / 7.90 |
| Support / Resistance 20 days | 140.35 / 162.52 |
| Data as of | 16 September 2026 20:30 WIB |


