PG Stock Technicals Today: Gains 0.24%, Testing Key Resistance
On September 17, 2026: price 147.02 USD, trend sideways, RSI 54.8, support 142.64, resistance 147.64. technical analysis of pg stock. PG Stock Technicals —…

Procter & Gamble’s shares finished at 147.02 USD on the NYSE, up 0.24% on the day and extending a 3.07% gain over five days, with the stock now sitting near the upper end of its short-term range. The tape is not screaming breakout, but it is quietly improving: price is above both the SMA20 at 145.23 and the SMA50 at 146.15, while the broader setup remains sideways. That combination matters because it suggests the market is accepting higher prices without yet committing to a full trend change.
Trend & Price Action
The first signal in the chart is simple: PG is holding above its short- and medium-term moving averages, which usually means recent buyers have been willing to pay up rather than fade strength. As shown in the chart, the price is above the SMA20 and SMA50, but the absence of a fresh MA-cross means this is still a confirmation phase, not a new trend regime. The SMA20 slope of 0.30% over five days points to a modest upward tilt, not a sharp acceleration. In plain language, the stock is leaning higher, but gently.
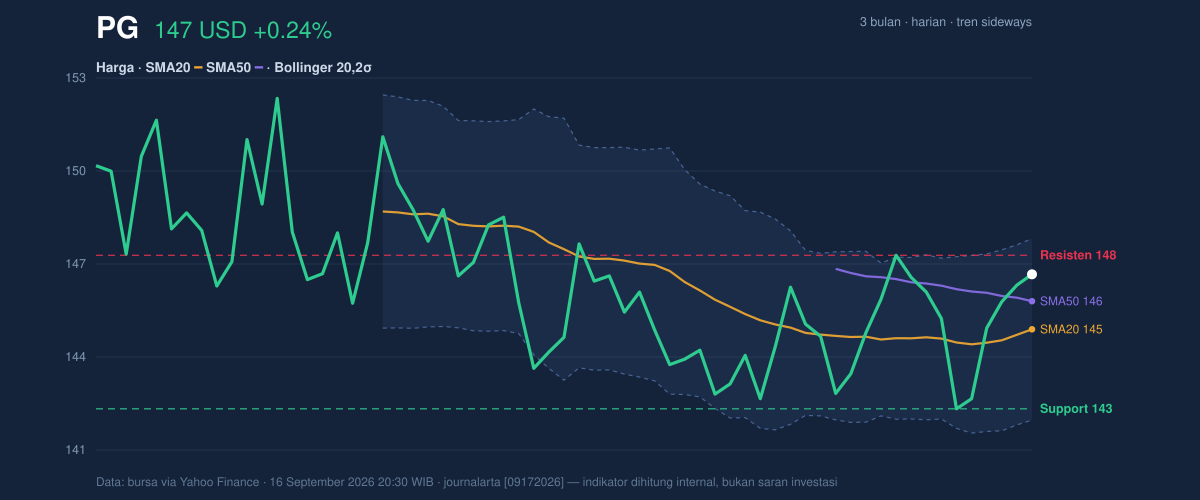
The position inside the range is also telling. PG is trading at 88% of its 20-hour range, close to the top rather than the middle, which shows buyers have regained control intraday. Yet the stock remains below the 20-hour resistance at 147.64, so the market is still testing whether this advance has enough conviction to clear nearby supply. The 3-month high of 154.32 and 3-month low of 140.20 frame the longer swing: PG has recovered from the lower part of that band, but it has not reclaimed the upper zone that would signal stronger trend expansion.
A short move higher is not the same as a breakout.
Oscillators & Momentum
Momentum indicators are mostly constructive, but not euphoric. The RSI at 54.8 is neutral, which means the stock is neither overbought nor oversold and still has room to move in either direction. That is important because a neutral RSI paired with a rising price often reflects orderly accumulation rather than a stretched advance. The Stochastic %K at 79.4 and %D at 73.0 sit near the upper end of the scale, which shows short-term momentum is stronger than the broader neutral RSI suggests. In practical terms, the stock is moving with some urgency, but not yet at a level that typically signals exhaustion.
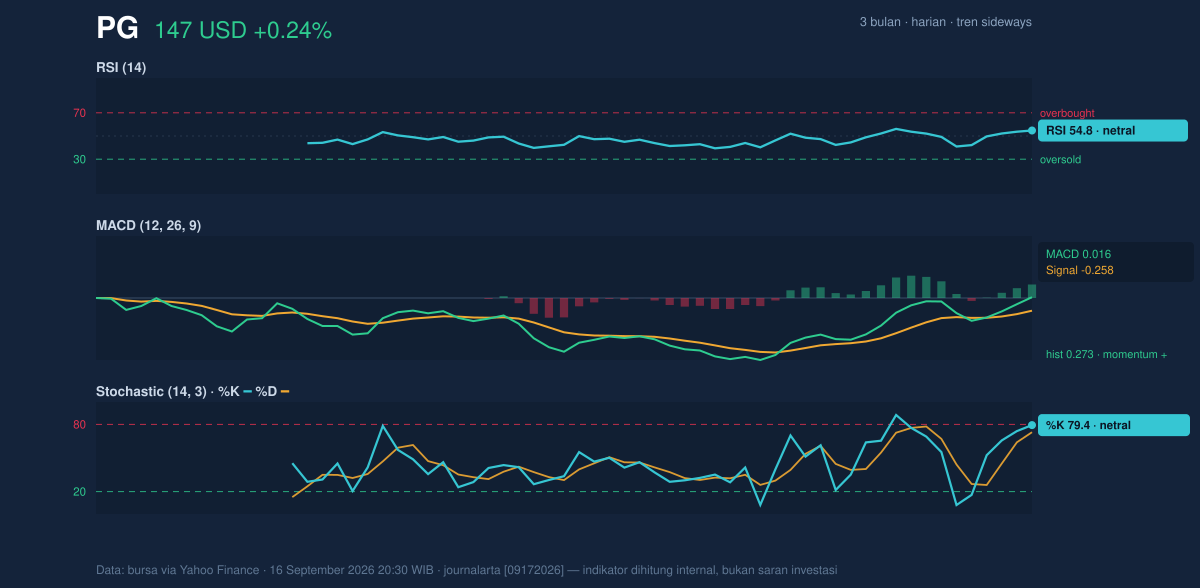
The most supportive signal is the MACD at 0.016 with a signal line at -0.258 and a positive histogram of 0.273. MACD measures whether recent price action is gaining or losing force, and this setup says the near-term push is still improving. The positive histogram means the gap between MACD and its signal line is widening in favor of the bulls. That does not guarantee continuation, but it does show momentum is aligned with the recent price lift rather than diverging from it.
Volatility & Volume
Volatility is not elevated enough to imply disorder, but it is compressing enough to matter. The Bollinger Bands are narrowing, with the upper band at 148.18, the middle at 145.23, and the lower band at 142.27; the 4.1% band width suggests a squeeze, which often precedes a sharper move once price leaves the range. The current %B of 80% shows PG is trading high in that band structure, meaning it is leaning toward the upper boundary rather than the lower one. In technical terms, the stock is pressing into the top part of its recent volatility envelope.
Volume, however, is the caution flag. The latest volume of 6,949,800 is only 0.8× the 20-day average of 9,094,060, so the price rise has not yet been backed by heavier participation. That matters because a move higher on lighter volume can reflect limited urgency rather than broad conviction. Still, the OBV is rising, which suggests that, over time, more volume has been flowing into up days than down days. That is a subtle but important confirmation: even if today’s turnover is not strong, the cumulative volume trend remains constructive.
Momentum is better than participation.
Key Levels & Scenarios
The market is focused on a tight set of levels. Immediate support sits at 142.64, just above the Bollinger lower band at 142.27, which creates a clear zone where buyers have recently defended the stock. On the upside, 147.64 resistance is the first hurdle, followed by the 148.18 Bollinger upper band. A clean push through that area would signal that the squeeze is resolving upward, while failure to hold above the mid-band around 145.23 would suggest the recent lift is losing momentum.
If PG clears 147.64 with improving volume, the chart would likely shift from a sideways recovery toward a more decisive range expansion. If it slips below 142.64, the short-term constructive tone weakens quickly and the market would be back testing the lower part of the recent structure.
Technical Verdict: HOLD (wait & see)
HOLD (wait & see) fits the current setup because the chart is constructive but not yet decisive.
- Price is above SMA20 and SMA50, which supports the short-term structure.
- MACD is positive and the histogram is in bullish territory, showing improving momentum.
- Bollinger Bands are squeezing, which raises the odds of a larger move, but direction is not yet confirmed.
- Verdict invalidated if price falls below 142.64, where near-term support is defined.
Ideal levels based on the chart:
- Entry Range: 145.23 to 147.64
- Exit Target: 148.18
- Stop Loss: 142.64
For non-traders, that means the stock is improving, but the chart still needs a cleaner break above resistance before the move looks fully established.
As of 16 September 2026 20:30 WIB, PG’s 20-hour support is 142.64 and 20-hour resistance is 147.64.
Summary Data PG
| Last price | 147.02 USD |
| Change 1 day / 5 days / 1 month | 0.24% / 3.07% / 2.49% |
| Trend / MA-cross | sideways / none |
| SMA20 / SMA50 | 145.23 / 146.15 |
| RSI (14) / Stochastic %K | 54.8 / 79.4 |
| Bollinger %B / ATR | 80% / 2.35 |
| Support / Resistance 20 days | 142.64 / 147.64 |
| Data as of | 16 September 2026 20:30 WIB |


