UOB Testing Key Resistance: Stock Gains 1.33% (September 18, 2026)
On September 18, 2026: price 41.88 SGD, trend sideways, RSI 46.6, support 40.22, resistance 42.33. technical analysis of uob stock. UOB Testing Key Resistance…

United Overseas Bank’s shares on the Singapore Exchange edged up to SGD 41.88 by 16 September 2026 08:00 WIB, rising 1.33% from the previous close of 41.33, but the move still sits inside a broader sideways pattern. The chart shows a stock that is holding above its short-term average, yet not convincingly escaping the range that has capped it for weeks. That matters because in technical analysis, a modest rise with muted participation often signals consolidation rather than a fresh trend.
Trend & Price Action
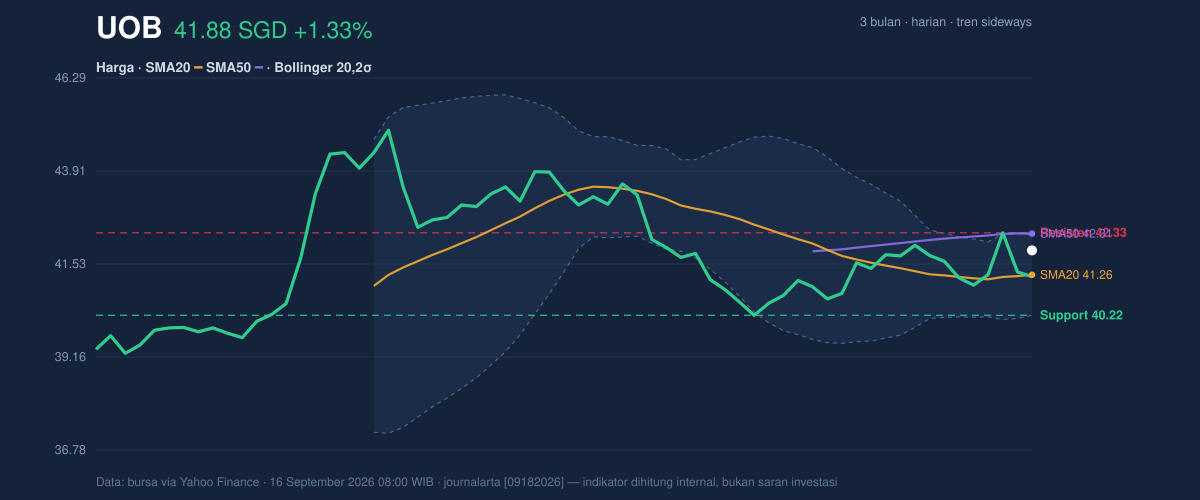
UOB is trading above its SMA20 at 41.26 but below its SMA50 at 42.31, which is a classic “in-between” setup: short-term buyers have the upper hand, but medium-term trend pressure has not fully turned positive. As shown in the chart, there is no fresh MA-cross, so the market has not yet produced the cleaner trend confirmation that usually comes when a faster average decisively overtakes a slower one. The stock is also sitting at about 79% of its 20-day range, close enough to resistance to suggest momentum is improving, but not so far above support that downside risk has disappeared.
The broader range provides the context. Over the past three months, UOB has traded between 45.15 and 38.99, which frames the current price as a recovery from the lower half of that band rather than a breakout into new territory. The 20-day support at 40.22 and 20-day resistance at 42.33 are the nearest reference points, and the price is now pressing against the upper part of that corridor.
Oscillators & Momentum
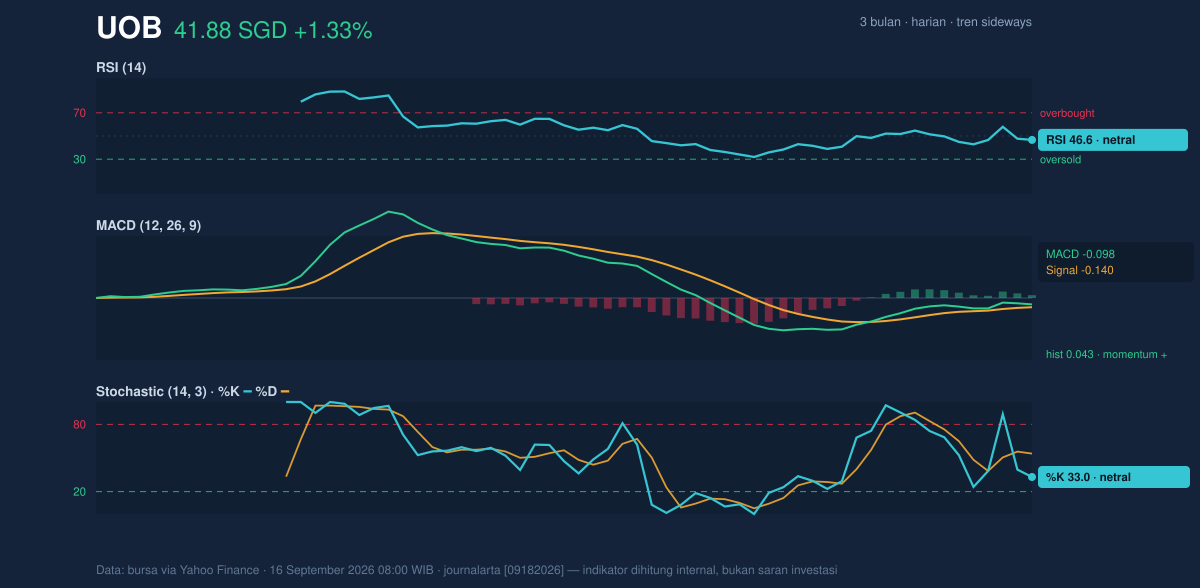
The momentum picture is mixed, but it is not bearish. The RSI at 46.6 is neutral, which usually means the stock is neither overbought nor oversold and still needs a stronger catalyst to extend the move. The Stochastic %K at 33.0 and %D at 53.9 also point to a market that has recovered from weakness but has not yet fully rebuilt upside momentum; the gap between the two lines suggests the rebound is still in progress rather than complete.
The more constructive signal comes from MACD at -0.098, with the signal line at -0.140 and a positive histogram of 0.043. In plain language, that means downside momentum has weakened and the short-term trend is beginning to improve, even though the indicator has not yet crossed into a clearly bullish territory. This is the kind of setup traders often watch for a follow-through move, but it still needs confirmation from price and volume.
Volatility & Volume
Volatility is low. The ATR at 0.62, equal to 1.5% of price, indicates that UOB is not currently making large daily swings, which often happens when a stock is coiling before a larger move. That reading fits with the 5.0% Bollinger Band width, which is narrowing in a squeeze pattern. A squeeze does not tell direction by itself, but it does mean the market is compressing energy and may be preparing for a sharper break once one side gains control.
The position inside the Bollinger envelope is also telling. Price is above the middle band at 41.26 and below the upper band at 42.29, with %B at 80%. That suggests the stock is leaning toward the upper end of its recent volatility range, but not yet stretched enough to look technically exhausted. The caution flag is participation: volume at 2,652,000 is only 0.9× normal, and OBV is falling. OBV, or on-balance volume, tracks whether volume is supporting price direction; a decline there implies the recent lift has not been strongly backed by accumulation.
Key Levels & Scenarios
The immediate battleground is tight. Resistance at 42.33 is just above the upper Bollinger band at 42.29, so a clean move through that area would matter because it would place price beyond both the recent range ceiling and the volatility envelope. If that happens, the market would be signaling that the squeeze is resolving upward.
On the downside, support at 40.22 is the first line to watch. A failure there would push price back through the Bollinger middle band and likely weaken the idea that the current bounce is building into something more durable. Because the stock is already above the 20-day average, holding that area matters for maintaining the short-term constructive tone.
The signal set is therefore balanced, not emphatic. Price is improving, momentum is stabilizing, and volatility is compressed, but volume and OBV are not yet confirming a broad commitment from the market. In chart terms, UOB looks like a stock waiting for a decisive push rather than one already in a confirmed trend.
Technical Verdict: HOLD (wait & see)
HOLD (wait & see)
- RSI at 46.6 and Stochastic at 33.0 / 53.9 are neutral, so momentum is improving but not strong enough to confirm a sustained breakout.
- MACD is positive on the histogram at 0.043, which supports a recovery, yet OBV is falling and volume is only 0.9× normal, so participation is still weak.
- The price is above SMA20 at 41.26 but below SMA50 at 42.31, leaving the trend unfinished while Bollinger bands are squeezing and hinting at a pending move.
- Verdict invalidated if price falls below 40.22.
- Ideal Entry Range: 41.26 to 42.33
- Exit Target (Target Price): 42.33, then the upper 3-month range at 45.15 if resistance gives way
- Stop Loss protection: below 40.22
In plain English, the shares are improving, but the market has not yet shown enough conviction to say the next move has fully started.
Summary Data UOB
| Last price | 41.88 SGD |
| Change 1 day / 5 days / 1 month | 1.33% / 1.70% / 3.25% |
| Trend / MA-cross | sideways / none |
| SMA20 / SMA50 | 41.26 / 42.31 |
| RSI (14) / Stochastic %K | 46.6 / 33.0 |
| Bollinger %B / ATR | 80% / 0.62 |
| Support / Resistance 20 days | 40.22 / 42.33 |
| Data as of | 16 September 2026 08:00 WIB |

