AMD Stock Gains 2.70%, Testing Key Resistance In Focus
On September 21, 2026: price 559.82 USD, trend sideways, RSI 65.1, support 456.16, resistance 559.82. technical analysis of amd stock. AMD Stock Gains — full…

AMD’s latest move leaves the stock pressing against the top of its recent range, a sign that momentum is still in charge even as some short-term gauges flash caution for international investors watching U.S. chip names.
Advanced Micro Devices closed at 559.82 USD, up 2.70% on the day, extending a 8.46% rise over five days and a 19.25% gain over one month. That is not just a steady climb; it is a move that has carried the shares from a mid-range posture into a test of the upper boundary, with the price now sitting at 100% of the 20-hour range and only a step below the 3-month high of 584.73. For readers unfamiliar with technical charting, that means the stock is no longer searching for direction — it is trying to prove it can hold elevated levels after a sharp run.
Trend & Price Action
The broader trend is still labeled sideways, but that word needs context. The SMA20 at 490.75 and SMA50 at 495.85 are both well below the current price, which shows AMD has pushed decisively above its short- and medium-term averages. In plain terms, the market has already repriced the stock higher than where it spent much of the recent period, and the 1.81% five-day slope in the SMA20 suggests that the short-term trend is tilting upward rather than flattening out.
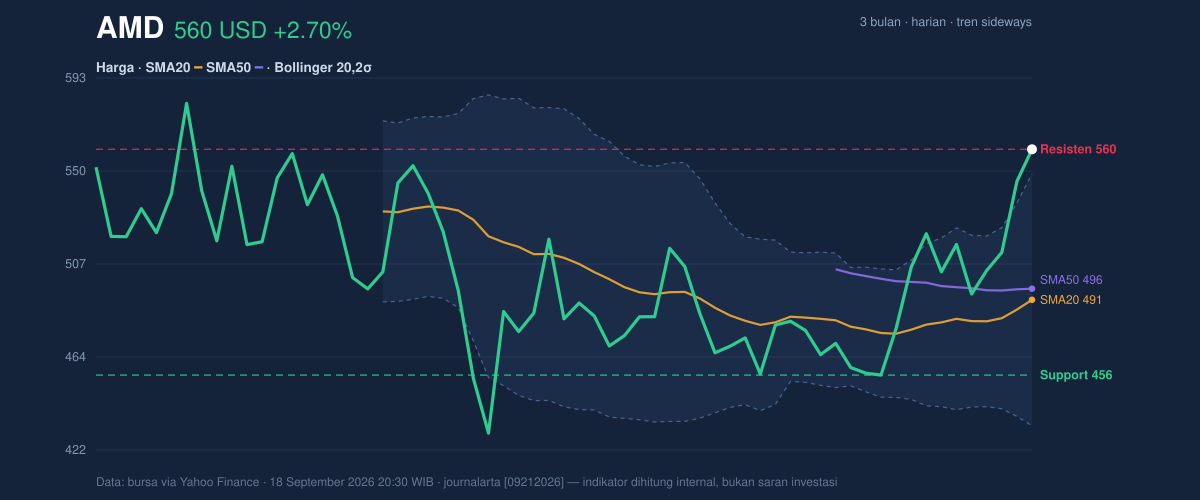
What matters now is not whether the stock has rallied — it clearly has — but whether the move is becoming stretched. The upper Bollinger band at 548.62 has already been exceeded, and the price is trading above it. That usually signals strength, but it can also mean the stock is temporarily running ahead of its average trading envelope. The absence of a fresh MA-cross tells us there was no dramatic new moving-average crossover to confirm a fresh phase change; instead, the rally has been built on accumulation and positive follow-through.
Oscillators & Momentum
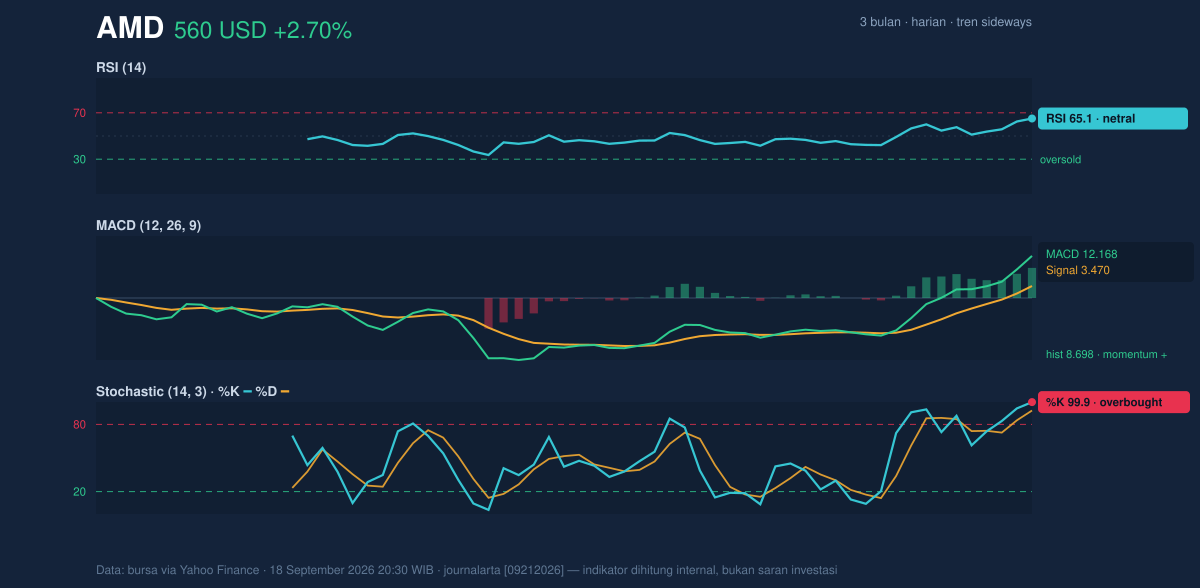
Momentum remains constructive, but it is no longer cleanly balanced. The MACD at 12.168 sits above its signal line at 3.470, with a histogram of 8.698. That combination is important because it shows the recent price advance is still being supported by underlying trend momentum, not just a one-day burst. In technical terms, MACD is measuring whether the faster trend is outrunning the slower one, and here the answer is yes.
The caution comes from the oscillators. The RSI at 65.1 is still described as neutral, which means it has not yet entered a classic overbought extreme. But the Stochastic %K at 99.9 and %D at 92.4 are already in overbought territory. That matters because stochastic tends to react faster than RSI, so it often warns that price has moved too far, too fast, even while trend indicators remain positive. The signal is not that momentum has broken; it is that the stock may be vulnerable to pauses, intraday reversals, or a period of consolidation after the recent surge.
Volatility & Volume
Volatility is clearly elevated. The Bollinger band width of 23.6% is described as expanding, and the ATR(14) of 22.33 equals 4.0% of price. ATR, or average true range, is a gauge of how much a stock typically moves in a session. At this level, AMD is not behaving like a quiet large-cap; it is moving with enough force that daily swings can be meaningful. That makes the current breakout-like posture more powerful, but also less forgiving if momentum fades.
Volume supports the move. Last trade volume of 31,785,700 was about 1.7× the 20-hour average of 19,056,775, and OBV is rising. OBV, or on-balance volume, tracks whether volume is flowing into or out of the stock. A rising OBV alongside a price advance suggests the rally is being backed by participation rather than drifting higher on thin turnover. That is one of the stronger bullish signals in the data set.
Key Levels & Scenarios
The immediate reference point is blunt: the stock is already at the 20-hour resistance of 559.82, which is also the latest close. Above that, the next visible ceiling is the 3-month high of 584.73. On the downside, the first support to watch is the 20-hour support of 456.16, with the upper Bollinger band at 548.62 now acting as a near-term line of defense if the stock starts to cool.
If AMD can hold above the upper band and keep volume elevated, the chart suggests continuation is still possible. If it slips back below the band and momentum softens, the overbought stochastic reading argues for a sharper pullback than a casual pause. That is the tension in the current setup: the trend is positive, but the stock is also priced for strength.
Technical Verdict: HOLD (wait & see)
- Strongest reasons: MACD is positive and widening, volume is 1.7× average with OBV rising, and price remains above SMA20 and SMA50.
- Strongest caution: Stochastic is overbought, price is above the upper Bollinger band, and ATR is elevated, which raises the risk of a sharp swing.
- Verdict invalidated if price falls below 548.62, the upper Bollinger band, because that would suggest the breakout is losing traction.
- Ideal Entry Range: 548.62 to 559.82
- Exit Target: 584.73
- Stop Loss protection: 456.16
For non-traders, this means AMD still looks strong, but the chart is now asking whether the recent surge can hold its height rather than whether it can keep rising uninterrupted.
“The next move will tell us whether this is a real breakout or just a very fast sprint.”
Summary Data AMD
| Last price | 559.82 USD |
| Change 1 day / 5 days / 1 month | 2.70% / 8.46% / 19.25% |
| Trend / MA-cross | sideways / none |
| SMA20 / SMA50 | 490.75 / 495.85 |
| RSI (14) / Stochastic %K | 65.1 / 99.9 |
| Bollinger %B / ATR | 110% / 22.33 |
| Support / Resistance 20 days | 456.16 / 559.82 |
| Data as of | 18 September 2026 20:30 WIB |



