AVGO Stock Gains 2.97% Today, Momentum Weakens
On September 21, 2026: price 357.61 USD, trend downtrend, RSI 45.5, support 339.27, resistance 371.54. technical analysis of avgo stock.

Broadcom’s shares are trying to stabilise after a short-term recovery, but the broader message from the chart is still one of a stock that has slipped below its near-term trend line and is waiting for confirmation. The latest move on NASDAQ left AVGO at 357.61 USD, up 2.97% on the day, yet still below the key moving averages that technicians use to judge whether momentum is healing or fading.
Trend & Price Action
As shown in the chart, Broadcom is trading below its SMA20 at 359.32 and well under the SMA50 at 379.76. That matters because the 20-day average is the market’s short-term balance point, while the 50-day line often acts as a test of whether a pullback is still just a pause or has turned into something deeper. Here, the fact that price remains under both lines keeps the stock in a downtrend, reinforced by the SMA20 slope of -2.22% over 5 days. A falling short-term average tells investors that recent prices have been drifting lower, even if the latest session bounced.
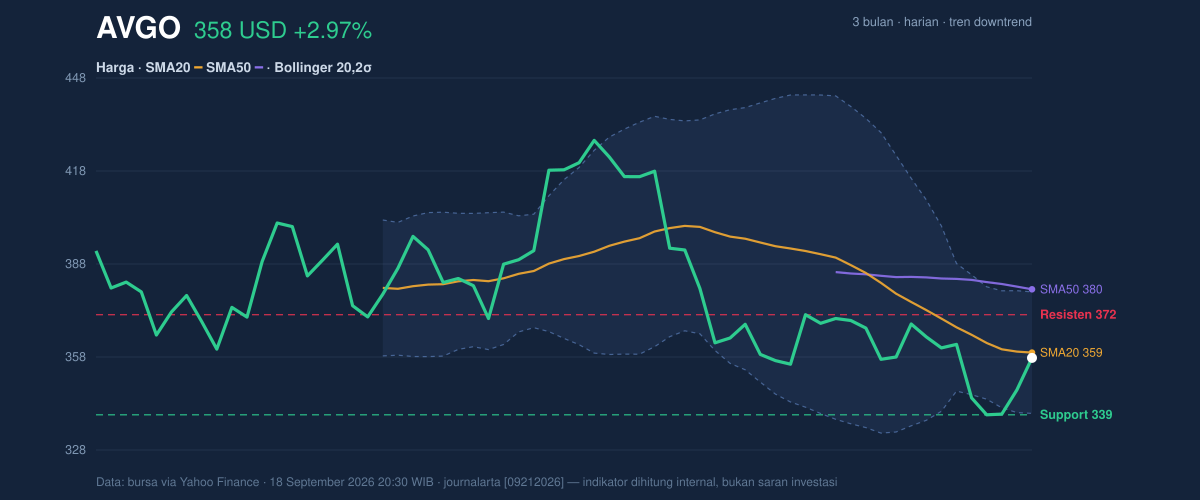
The price is also sitting in the upper half of the recent range, at 57% of the 20-hour band between support at 339.27 and resistance at 371.54. That positioning is important: it shows the market is not under immediate breakdown pressure, but it has not yet reclaimed enough ground to be called a clean recovery. The 3-month low at 335.81 sits just below nearby support, which means the market has already tested the lower end of its recent range and is still operating close to that floor.
Oscillators & Momentum
Momentum is more balanced than the trend line suggests, but not strong enough to overturn it. The RSI at 45.5 is neutral, which means the stock is neither stretched to the upside nor washed out on the downside. In plain language, RSI is measuring whether gains or losses have been too fast; a reading near the middle says the move has room to continue either way, but no strong conviction is present.
The Stochastic oscillator at 59.0 / 32.1 is also neutral. That setup hints at some short-term improvement in price position, but not a fully confirmed upward turn. More importantly, the MACD remains negative at -9.407, with the signal line at -8.987 and the histogram at -0.419. MACD is a trend-following momentum gauge, and a negative reading means shorter-term price action is still lagging the longer-term trend. The histogram being below zero reinforces that the bounce has not yet become a decisive trend reversal.
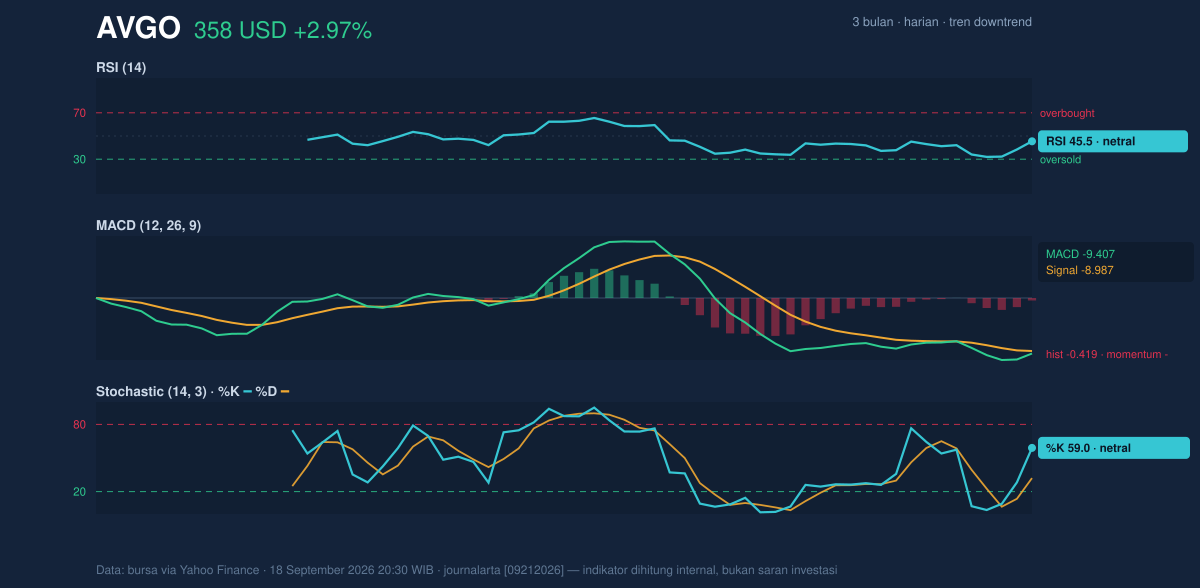
So the signal mix is mixed rather than bullish: oscillators are no longer oversold, but MACD is still negative, which tells traders the rebound is still unproven. That combination usually describes a stock that can continue to bounce, but is not yet showing the kind of momentum alignment that often precedes a sustained advance.
Volatility & Volume
Volatility looks manageable, not explosive. The ATR at 11.03, equal to 3.1% of the share price, points to moderate daily movement. ATR, or average true range, is a measure of how much a stock typically swings; here it suggests Broadcom is active enough to move meaningfully, but not in a disorderly way. The Bollinger Bands tell a similar story. With the middle band at 359.32, the upper band at 378.90, and the lower band at 339.74, the stock is hovering near the centre of its band structure, while %B at 46% says price is slightly below the midpoint between the lower and upper bands. The 10.9% band width is normal, which means the market is not in a volatility squeeze that would usually signal an imminent breakout.
Volume adds a constructive note. The latest session printed 43,948,400 shares, about 1.6x the 20-day average of 26,829,525. That is a meaningful participation spike, and the fact that OBV is rising suggests buyers are still accumulating on balance even while the price remains under pressure. In technical terms, that is a useful sign: volume is backing the rebound attempt, but price has not yet followed through enough to reverse the trend.
Key Levels & Scenarios
The chart leaves Broadcom with a clear battleground. The first level to watch is resistance at 371.54, then the SMA50 at 379.76 and the Bollinger upper band at 378.90. Those levels cluster tightly, so a move through one would likely invite attention on the others. If price can reclaim that zone, it would signal that the market is doing more than just bouncing inside a downtrend.
On the downside, support at 339.27 is the immediate line of defence, with the Bollinger lower band at 339.74 sitting almost on top of it. That alignment matters because it creates a technical shelf where buyers have already shown interest. A break below that area would expose the 3-month low at 335.81, and that would shift the discussion from consolidation to renewed weakness.
Technical Verdict: HOLD (wait & see)
HOLD (wait & see)
- MACD is still negative, so the rebound has not yet produced a confirmed trend reversal.
- Price remains below SMA20 and SMA50, which keeps the broader structure in a downtrend.
- Volume is 1.6x average and OBV is rising, showing participation is improving even though price confirmation is incomplete.
Verdict invalidated if price falls below 339.27.
- Ideal Entry Range: 339.27 to 359.32
- Exit Target: 371.54 to 379.76
- Stop Loss protection: below 335.81
For non-traders, this means Broadcom is showing signs of life, but the chart still needs proof that the recovery can hold above its short-term averages.
Summary Data AVGO
| Last price | 357.61 USD |
| Change 1 day / 5 days / 1 month | 2.97% / -1.21% / -1.76% |
| Trend / MA-cross | downtrend / none |
| SMA20 / SMA50 | 359.32 / 379.76 |
| RSI (14) / Stochastic %K | 45.5 / 59.0 |
| Bollinger %B / ATR | 46% / 11.03 |
| Support / Resistance 20 days | 339.27 / 371.54 |
| Data as of | 18 September 2026 20:30 WIB |



