UNH Stock Technicals Today: Gains 0.45%, Testing Support Level
On September 21, 2026: price 376.90 USD, trend downtrend, RSI 37.0, support 375.21, resistance 401.01. technical analysis of unh stock.

UnitedHealth Group shares slipped to 376.90 USD on the NYSE, leaving the stock just above its recent floor and still trading below the short- and medium-term trend lines. The move matters because it shows a large, defensive health-care name is not being treated as a safe haven by the market right now; instead, the chart is still being pulled lower by weak trend structure and negative momentum.
Trend & Price Action
The stock remains in a downtrend, with the SMA20 at 390.30 and the SMA50 at 404.33 both sitting above the current price. That positioning is important: when price stays below both moving averages, rallies tend to be treated as recovery attempts rather than confirmed trend reversals. The fact that the SMA20 slope is -0.99% over 5 days reinforces that the short-term trend is still leaning lower rather than flattening out.
There is also no fresh moving-average crossover to suggest a new trend regime. In practical terms, that means the chart has not yet produced the kind of technical reset that usually accompanies a durable rebound. The stock is not collapsing in a straight line, but it is still drifting under overhead resistance from its own trend markers.
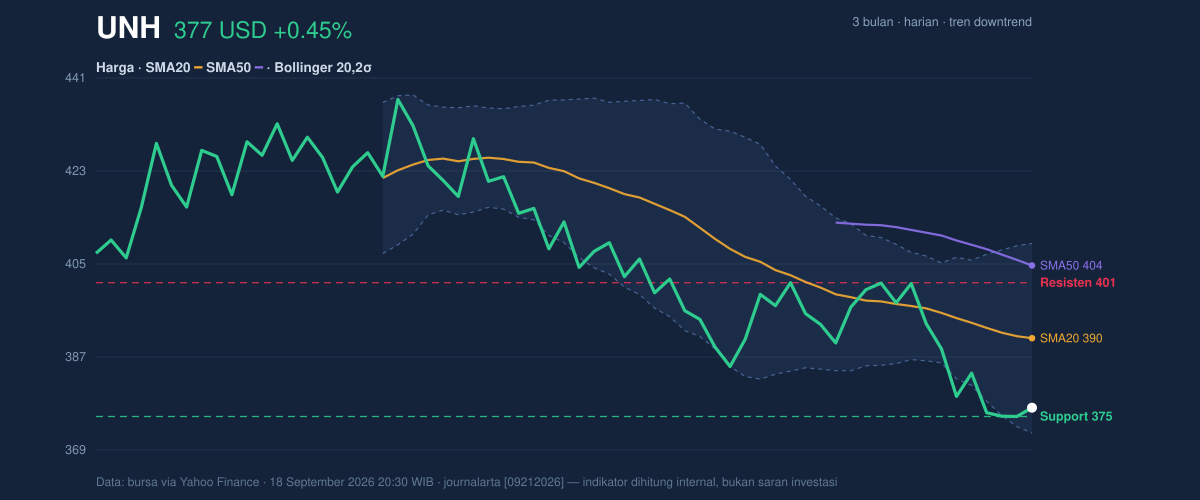
The price is sitting near the lower end of its recent range, with the 20-hour support at 375.21 and 20-hour resistance at 401.01. At 7% of the range, the stock is close to support, which often attracts bargain-hunting interest, but only if buyers can prove they are willing to defend that level. The 3-month low is 372.42, so the market is already operating close to the point where recent selling pressure has previously been absorbed.
Oscillators & Momentum
Momentum is mixed, and that is the key message from the oscillators. The RSI at 37.0 is technically neutral, but it sits close to the lower end of the scale, which tells readers the stock is weak without yet being deeply washed out. By contrast, the Stochastic %K at 13.1 and %D at 7.6 are both in oversold territory. That usually means the stock has been sold aggressively enough that a short-term bounce becomes more likely, but oversold does not automatically mean reversal; it simply means downside momentum may be stretched.
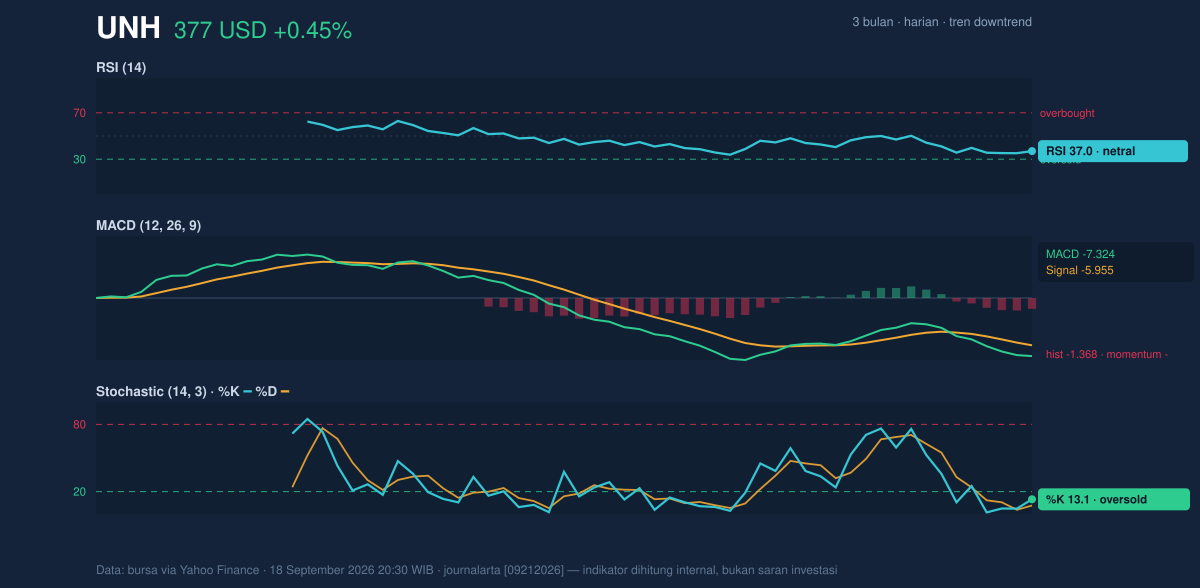
The more important caution sign is the MACD at -7.324, still below its signal line at -5.955, with a histogram of -1.368. That combination means downside momentum is still dominating the chart even as some oscillators begin to look tired. In plain language: the stock may be near a short-term bounce zone, but the broader momentum engine has not yet turned positive.
Volatility & Volume
Volatility is present, but not extreme. The ATR(14) at 10.20, equal to 2.7% of price, suggests the stock is capable of meaningful daily swings without being in panic mode. That matters because a move through support or resistance is more likely to be followed through when volatility is sufficient to carry price beyond a level, rather than trapping it in a narrow band.
The Bollinger setup adds another layer. Price is near the lower band, with the lower Bollinger band at 372.01 and %B at 13%. A low %B means the stock is trading very close to the bottom of its recent volatility envelope, which often reflects either exhaustion selling or the start of a deeper break. The distinction depends on follow-through. Since the Bollinger band width is 9.4% and described as normal, this is not a volatility squeeze that typically precedes a dramatic breakout; it is a standard range where the next move still needs confirmation.
Volume, however, is the one area showing real participation. Last session volume was 8,606,300, about 1.7× the 20-day average of 4,950,310. Heavy volume on a weak chart can mean capitulation, but the OBV is falling, which signals that the balance of volume has still been favoring sellers over time. In other words, the market is trading actively, but not yet accumulating the shares in a way that would confirm a durable base.
Key Levels & Scenarios
The immediate technical map is clear. The first level to watch is 375.21; that is the nearest support and also the latest reference point for whether buyers can keep the stock from slipping further. If that area holds, a rebound toward the 390.30 midpoint and then the 401.01 resistance zone becomes the most logical path. If price fails to hold 375.21, the chart risks testing the 372.42 3-month low, which would confirm that the market is still probing for a stronger floor.
The upside is capped for now by the SMA20 at 390.30 and then the SMA50 at 404.33. Those levels matter because they are not just arbitrary numbers; they represent where recent buyers have already lost control of the trend. A move back above them would be needed to shift the chart from defensive to constructive.
Technical Verdict: HOLD (wait & see)
HOLD (wait & see) fits the chart best because the stock is near support and oversold on Stochastic, but the broader trend and MACD remain negative.
- Reason 1: The price is still below the SMA20 at 390.30 and SMA50 at 404.33, so the trend has not turned up.
- Reason 2: The MACD is negative and below its signal line, showing downside momentum is still in control.
- Reason 3: Stochastic is oversold and price is near the 375.21 support, which raises the chance of a bounce but does not confirm it.
- Verdict invalidated if price breaks below 375.21, because that would expose the 372.42 3-month low and weaken the case for a near-term base.
- Ideal entry range: 375.21 to 372.42, where support and the lower Bollinger band cluster.
- Exit target: 390.30 to 401.01, where the SMA20 and nearby resistance sit.
- Stop loss protection: Below 372.42, if the support shelf fails.
For non-traders, this means the stock is close to a possible turning point, but the chart has not yet shown enough strength to say the decline is over.
UnitedHealth’s next technical test is whether 375.21 can hold as the market watches the 372.42 low.
Summary Data UNH
| Last price | 376.90 USD |
| Change 1 day / 5 days / 1 month | 0.45% / -0.58% / -2.07% |
| Trend / MA-cross | downtrend / none |
| SMA20 / SMA50 | 390.30 / 404.33 |
| RSI (14) / Stochastic %K | 37.0 / 13.1 |
| Bollinger %B / ATR | 13% / 10.20 |
| Support / Resistance 20 days | 375.21 / 401.01 |
| Data as of | 18 September 2026 20:30 WIB |


