DIS Stock Analysis: Gains 1.52%, Momentum Weakens
On September 22, 2026: price 104.23 USD, trend sideways, RSI 47.0, support 102.67, resistance 111.25. technical analysis of dis stock. DIS Stock Analysis —…

On 21 September 2026 at 20:30 WIB, Walt Disney shares finished at 104.23 USD, up from the previous close of 102.67, but the bigger message in the tape was not the day’s gain. As shown by the chart, the stock is still trading below SMA20 at 106.82 while sitting just above SMA50 at 102.88, a setup that points to a market still searching for direction rather than a clean trend. The price is also inside a narrowing Bollinger band, with upper band 111.04 and lower band 102.61, which means the stock has been compressing rather than trending — a condition that often precedes a sharper move, but not necessarily an upward one.
Trend & Price Action
The current structure is best described as sideways, and the slope of SMA20 at -0.18% over 5 days reinforces that message. In plain terms, the short-term average is still drifting lower, so recent strength has not yet been strong enough to reverse the softer trend. Disney’s share price is now below SMA20 but still above SMA50, which usually signals a market in transition: the short-term tone is weaker than the medium-term base, but the longer trend has not broken down.
That matters because the stock is trading near the lower half of its recent range. The 20-hour support at 102.67 sits just beneath the last price, while 20-hour resistance at 111.25 is still overhead. With the price at only 18% of the range, the market is positioned much closer to support than resistance, which often leaves less room for immediate upside unless buyers can absorb supply above the moving average cluster.
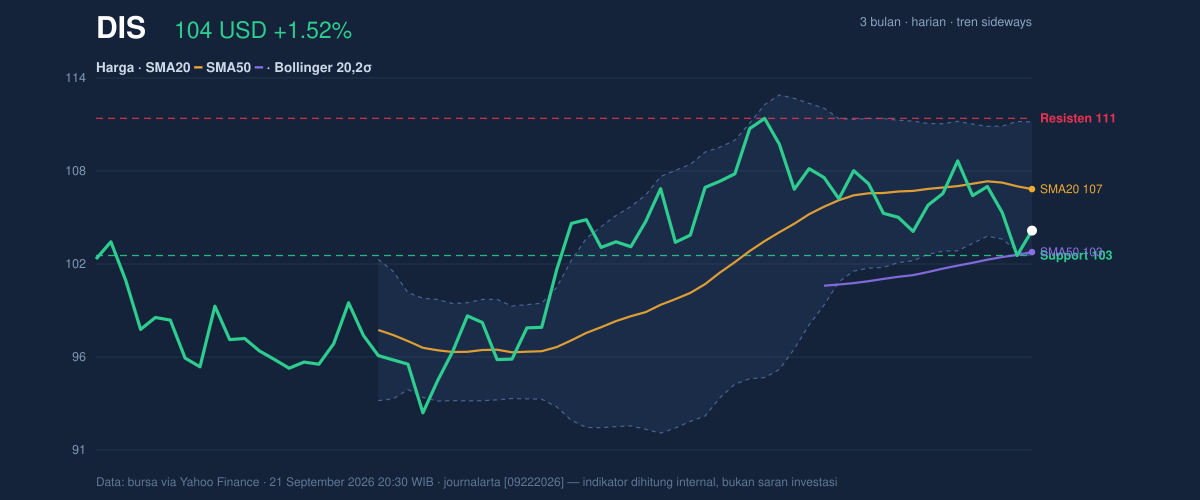
The chart also shows the 3-month range from 92.49 to 111.87. Disney is not near the bottom of that range, but it is clearly not pressing the highs either. That positioning says the market is still treating the stock as a range trade, not a breakout story.
Oscillators & Momentum
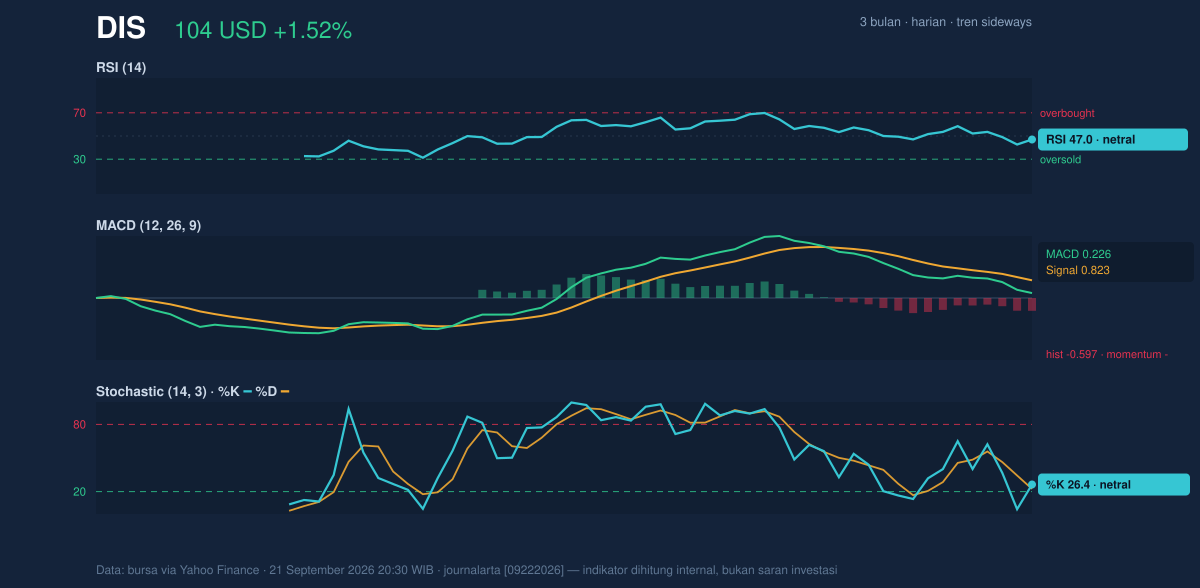
Momentum is mixed, and that is the key signal. RSI at 47.0 is neutral, which means the stock is neither stretched upward nor washed out. Stochastic %K at 26.4 and %D at 22.4 are also neutral, but they are sitting near the lower end of the scale, showing the stock has recently been weak without yet tipping into a full oversold condition. In practice, that often reflects a market that has cooled off but has not clearly turned.
The more important caution comes from MACD. MACD at 0.226 is still below the signal line at 0.823, and the histogram at -0.597 shows negative momentum. That means the recent price bounce is not yet backed by a confirmed momentum turn. When MACD remains below its signal line, rallies can be fragile because the underlying impulse is still weaker than the short-term average of that impulse.
So the oscillator picture is not bearish in an extreme sense, but it is not constructive enough to call the stock fully repaired. It is a market waiting for confirmation.
Volatility & Volume
Volatility is moderate, with ATR(14) at 2.34, or 2.2% of price. That tells readers the stock is moving enough to matter, but not in a panic phase. The more interesting clue is the Bollinger setup: the band width is only 7.9%, and the bands are narrowing. A squeeze like this usually means the market is storing energy. The next move can be larger than recent daily swings, but the direction still depends on whether price can reclaim the middle band at 106.82 or lose the lower band near 102.61.
Volume has not yet validated the latest move. The stock traded 7,126,400 shares versus a 20-day average of 8,366,525, or about 0.9x normal. That is not the kind of participation that usually confirms a decisive shift in sentiment. Meanwhile, OBV is falling, which means volume flow has been leaning against the shares even if the price has stabilized. In technical terms, that is a warning that buyers have not yet proven control.
The chart is compressing, but participation is still thin.
Key Levels & Scenarios
The immediate battle line is clear: support at 102.67 versus resistance at 111.25. Because the price is sitting close to support and below the short-term average, the market is vulnerable if that floor gives way. A failure to hold 102.67 would expose the lower Bollinger band at 102.61 and would also weaken the case that SMA50 at 102.88 is acting as a durable base.
If price can reclaim 106.82, the middle Bollinger band and SMA20, the chart would improve materially. That would suggest the recent softness is being absorbed and that the stock is trying to rotate back toward the overhead barrier at 111.04 to 111.25. Until then, the stock remains in a compressed range with no confirmed breakout.
Technical Verdict: HOLD (wait & see)
HOLD (wait & see)
- Price is below SMA20 at 106.82, which keeps the short-term trend soft.
- MACD remains below its signal line, and the negative histogram shows momentum is still weak.
- Bollinger bands are squeezing, which raises the chance of a larger move, but not yet a confirmed direction.
Verdict invalidated if price falls below 102.67, because that would break the nearest support and weaken the current base.
- Ideal Entry Range: 102.67 to 106.82
- Exit Target: 111.04 to 111.25
- Stop Loss Protection: below 102.61, with 102.67 as the key support trigger
In plain English: Disney’s chart is coiled, but the market has not yet proved whether the next move will be a recovery or another slip.
“Right now, the stock is asking for confirmation, not applause.”
Summary Data DIS
| Last price | 104.23 USD |
| Change 1 day / 5 days / 1 month | 1.52% / -4.02% / -3.29% |
| Trend / MA-cross | sideways / none |
| SMA20 / SMA50 | 106.82 / 102.88 |
| RSI (14) / Stochastic %K | 47.0 / 26.4 |
| Bollinger %B / ATR | 19% / 2.34 |
| Support / Resistance 20 days | 102.67 / 111.25 |
| Data as of | 21 September 2026 20:30 WIB |



